. 2011 Aug;32(8):965-77.
doi: 10.1002/humu.21530. Epub 2011 Jul 12.

A pharmacogenetic approach to identify mutant forms of α-galactosidase A that respond to a pharmacological chaperone for Fabry disease

Affiliations
Free PMC article

A pharmacogenetic approach to identify mutant forms of α-galactosidase A that respond to a pharmacological chaperone for Fabry disease

Xiaoyang Wu et al. Hum Mutat. 2011 Aug.
Free PMC article

Abstract

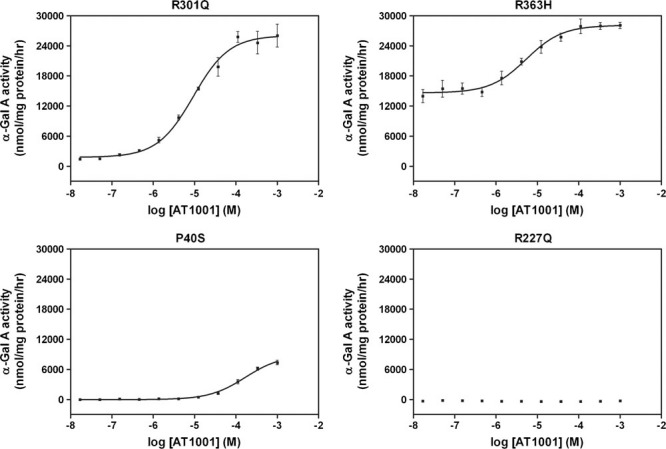
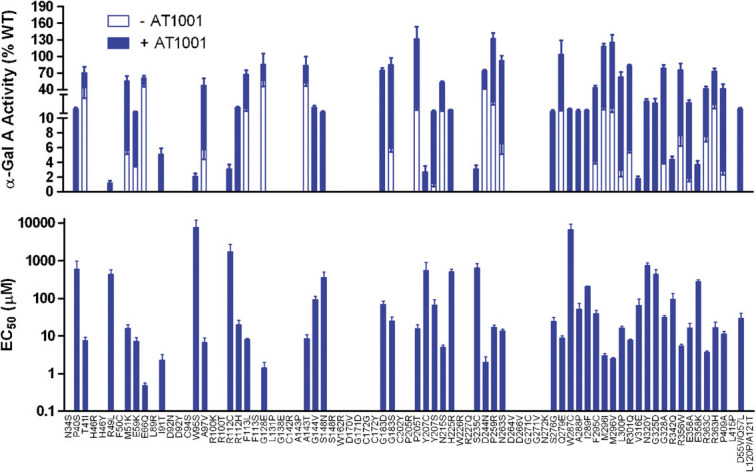
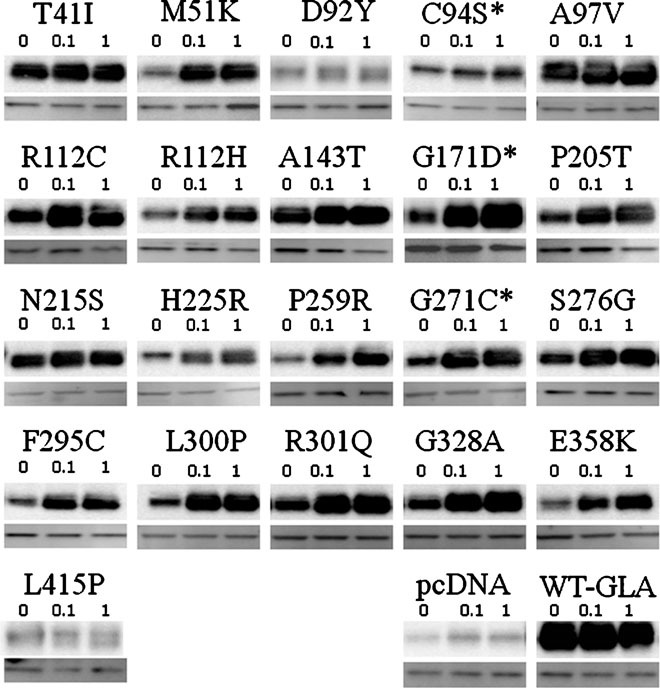
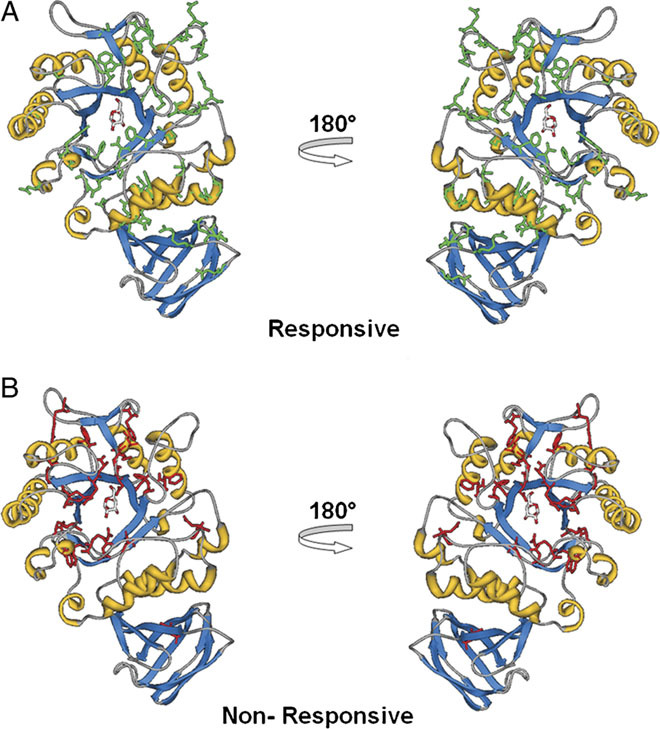
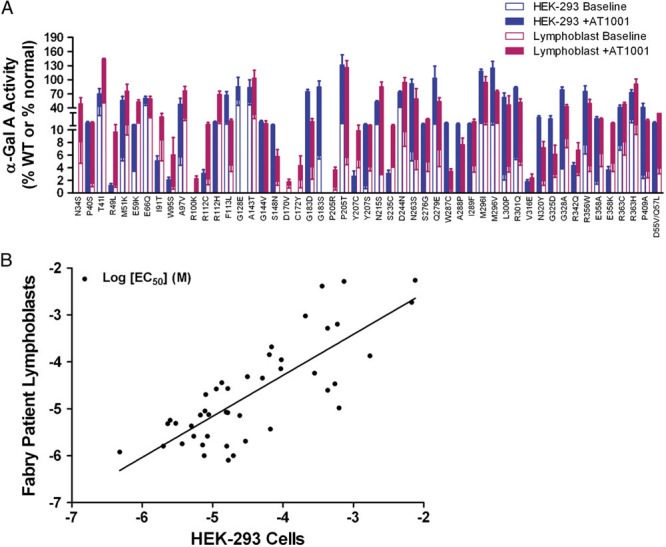
Fabry disease is caused by mutations in the gene (GLA) that encodes α-galactosidase A (α-Gal A). The iminosugar AT1001 (GR181413A, migalastat hydrochloride, 1-deoxygalactonojirimycin) is a pharmacological chaperone that selectively binds and stabilizes α-Gal A, increasing total cellular levels and activity for some mutant forms (defined as "responsive"). In this study, we developed a cell-based assay in cultured HEK-293 cells to identify mutant forms of α-Gal A that are responsive to AT1001. Concentration-dependent increases in α-Gal A activity in response to AT1001 were shown for 49 (60%) of 81 mutant forms. The responses of α-Gal A mutant forms were generally consistent with the responses observed in male Fabry patient-derived lymphoblasts. Importantly, the HEK-293 cell responses of 19 α-Gal A mutant forms to a clinically achievable concentration of AT1001 (10 µM) were generally consistent with observed increases in α-Gal A activity in peripheral blood mononuclear cells from male Fabry patients orally administered AT1001 during Phase 2 clinical studies. This indicates that the cell-based responses can identify mutant forms of α-Gal A that are likely to respond to AT1001 in vivo. Thus, the HEK-293 cell-based assay may be a useful aid in the identification of Fabry patients with AT1001-responsive mutant forms.


Figures

Figure 1
Figure 1
Responses to AT1001 for different mutant forms of α-Gal A. Representative α-Gal A activity (expressed as nmol 4-MU released/mg protein/hr) in lysates from HEK-293 cells transiently transfected with the indicated mutant α-Gal A construct and incubated with increasing concentrations of AT1001 is shown. AT1001 increased the activity of R301Q (top left panel), R363H (top right panel), and P40S (bottom left panel), but had no effect on R227Q (bottom right panel). Data points are the mean ± SEM of quadruplicate determinations. In the experiments shown, α-Gal A activity was increased 14.6-fold and 1.9-fold for R301Q and R363H, respectively (relative increase was not calculated for P40S because its baseline is 0). The EC50 values were 9.3, 5.4, and 170 µM for R301Q, R363H, and P40S, respectively. The data shown are representative of 24 (R301Q), 4 (R363H), 4 (P40S), and 3 (R227Q) independent experiments.
Figure 2
Figure 2
AT1001 increases the activity of different α-Gal A mutant forms with varying magnitude and potency. Top panel: Eighty-one mutant forms were evaluated in the HEK-293 cell-based assay for response to incubation with AT1001. The average baseline (open bars) and maximally increased (blue/dark bars) α-Gal A activity in the absence or presence of AT1001, respectively, are shown. The data have been normalized to the α-Gal A activity of untreated wild-type. Bottom panel: The average EC50 values (expressed as µM) for AT1001 to increase the α-Gal A activity of each mutant form are shown. For both panels, α-Gal A mutant forms were plotted in order of their positions on the amino acid sequence. Bars represent mean ± SEM of at least three independent experiments conducted for each mutant form. Mutant forms with no associated bar did not have any quantifiable baseline α-Gal A activity nor response to AT1001 at the concentrations tested. [Color figures can be viewed in the online issue, which is available at http://www.wiley.com/humanmutation.]
Figure 3
Figure 3
Western blot results for representative mutant forms of α-Gal A. HEK-293 cells transiently transfected with the indicated mutant forms of α-Gal A were incubated for 4 to 5 days without or with 0.1 or 1 mM AT1001 (represented by the numbers above the bands). Cell lysates were prepared as described for the enzyme assay and total protein concentrations were measured. An equal amount of total protein (1 µg) was loaded into each lane and Western blotting was performed according to standard protocols (see Materials and Methods). Mutant forms that showed a positive response to AT1001 in the α-Gal A activity assay generally showed increases in α-Gal A protein levels after incubation with AT1001. Those showing an increase in the protein but no increase in the enzyme activity assay after incubation with AT1001 are indicated by an asterisk (*). Western blots of GAPDH as an additional control for equal protein loading in each lane are also provided. Representative blots of pcDNA only and wild-type GLA transfected HEK-293 cells are provided as negative and positive controls. The data for the controls and for each mutant form are representative of at least three independent experiments with similar results.
Figure 4
Figure 4
Locations of residues with point mutations in mutant forms of α-Gal A. Eighty-one amino acid residues corresponding to the missense mutations tested in the HEK-293 cell-based assay were mapped onto the structure of the α-Gal A monomer. The α-Gal A monomeric structure is shown in ribbon representation with the bound galactose ligand and affected residues displayed in stick format. Residues with point mutations in AT1001-responsive (A) and nonresponsive (B) mutant forms of α-Gal A are colored green and red, respectively.
Figure 5
Figure 5
The mutant α-Gal A responses to AT1001 in HEK-293 cells are comparable to those from Fabry patient lymphoblasts. A: The HEK-293 cell and Fabry patient lymphoblast [Benjamin et al., 2009] average baseline and maximally increased α-Gal A activity after AT1001 incubation are shown for 51 different mutant forms that were responsive in either assay (the data are not shown for 24 other mutant forms that consistently did not respond to AT1001 in both assays). The HEK-293 cell data have been normalized to the baseline α-Gal A activity in wild-type-transfected HEK-293 cells. The patient lymphoblast data have been normalized to the baseline α-Gal A activity in normal human lymphoblasts. B: Correlation analysis of the average EC50 values (expressed as the logEC50 [M]) for AT1001-increased α-Gal A activity of 44 different mutant forms that were responsive in both assays is shown. The logEC50 values of the AT1001-mediated responses were significantly correlated (Pearson correlation coefficient [r] was 0.793 with a two-tailed P-value of <0.0001) between the HEK-293 cell and the patient lymphoblast assays. Significant correlations of the baseline α-Gal A activity and the maximum α-Gal A activity after AT1001 incubation were also found between these two assays (Pearson correlation coefficients [r] were 0.760 and 0.751, respectively, with two-tailed P-values <0.0001 and n = 75 for each; plots not shown).

Similar articles

Cited by

References

    1. Altman DG, Bland JM. Diagnostic tests 2: predictive values. BMJ. 1994a;309:102. - PMC - PubMed
    1. Altman DG, Bland JM. Statistics notes: diagnostic tests 1: sensitivity and specificity. BMJ. 1994b;308:1552. - PMC - PubMed
    1. Andreotti G, Guarracino M, Cammisa M, Correra A, Cubellis MV. Prediction of the responsiveness to pharmacological chaperones: lysosomal human alpha-galactosidase, a case of study. Orphanet J Rare Dis. 2010;5:36. - PMC - PubMed
    1. Asano N, Ishii S, Kizu H, Ikeda K, Yasuda K, Kato A, Martin OR, Fan JQ. In vitro inhibition and intracellular enhancement of lysosomal alpha-galactosidase A activity in Fabry lymphoblasts by 1-deoxygalactonojirimycin and its derivatives. Eur J Biochem. 2000;267:4179–4186. - PubMed
    1. Bekri S, Enica A, Ghafari T, Plaza G, Champenois I, Choukroun G, Unwin R, Jaeger P. Fabry disease in patients with end-stage renal failure: the potential benefits of screening. Nephron Clin Pract. 2005;101:c33–c38. - PubMed

MeSH terms