. 2011 May;133(5):051002.
doi: 10.1115/1.4002698.

A microstructurally driven model for pulmonary artery tissue

Affiliations

A microstructurally driven model for pulmonary artery tissue

Philip H Kao et al. J Biomech Eng. 2011 May.

Abstract

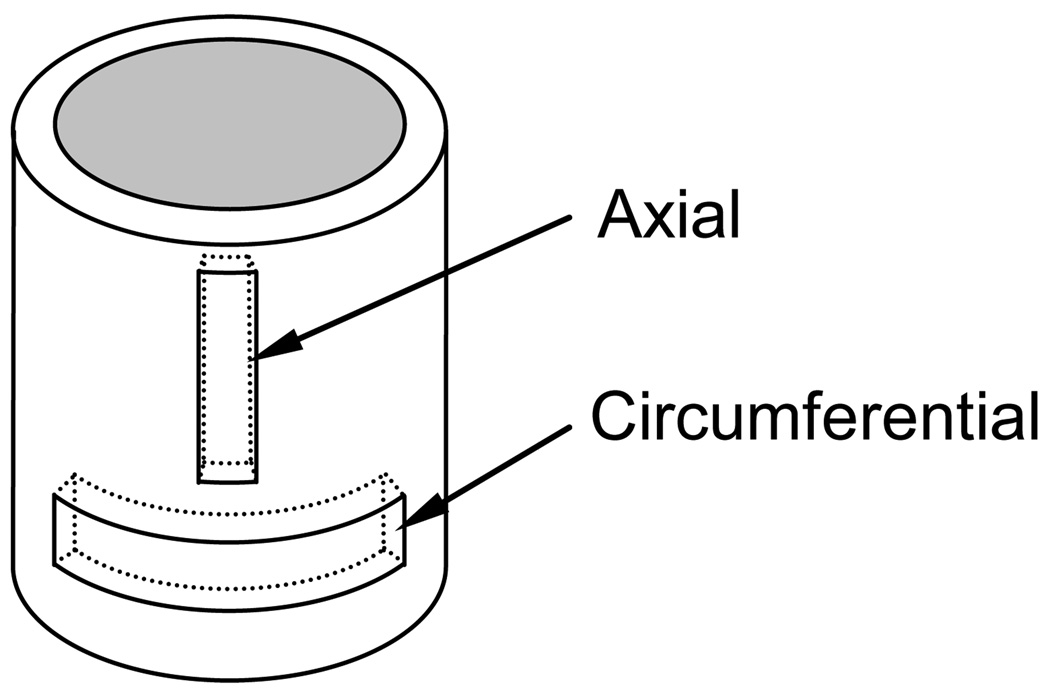
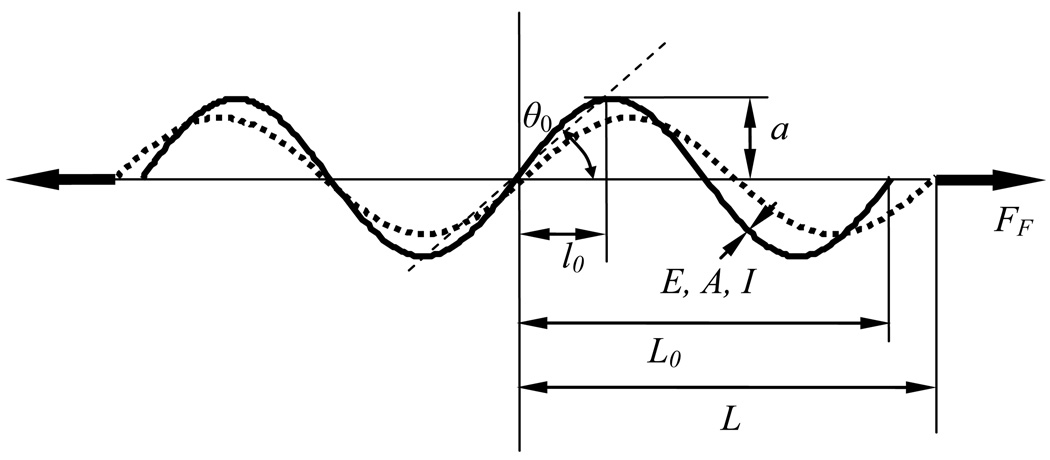
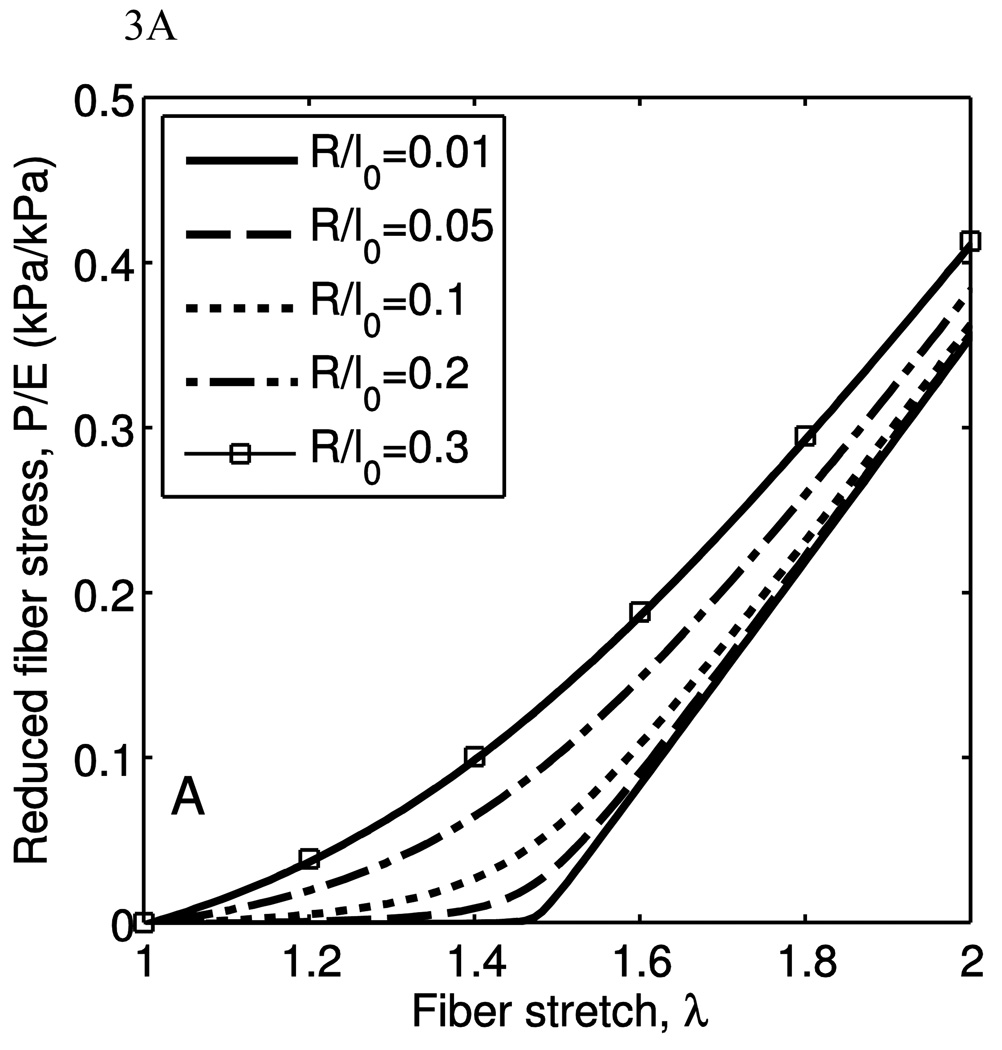
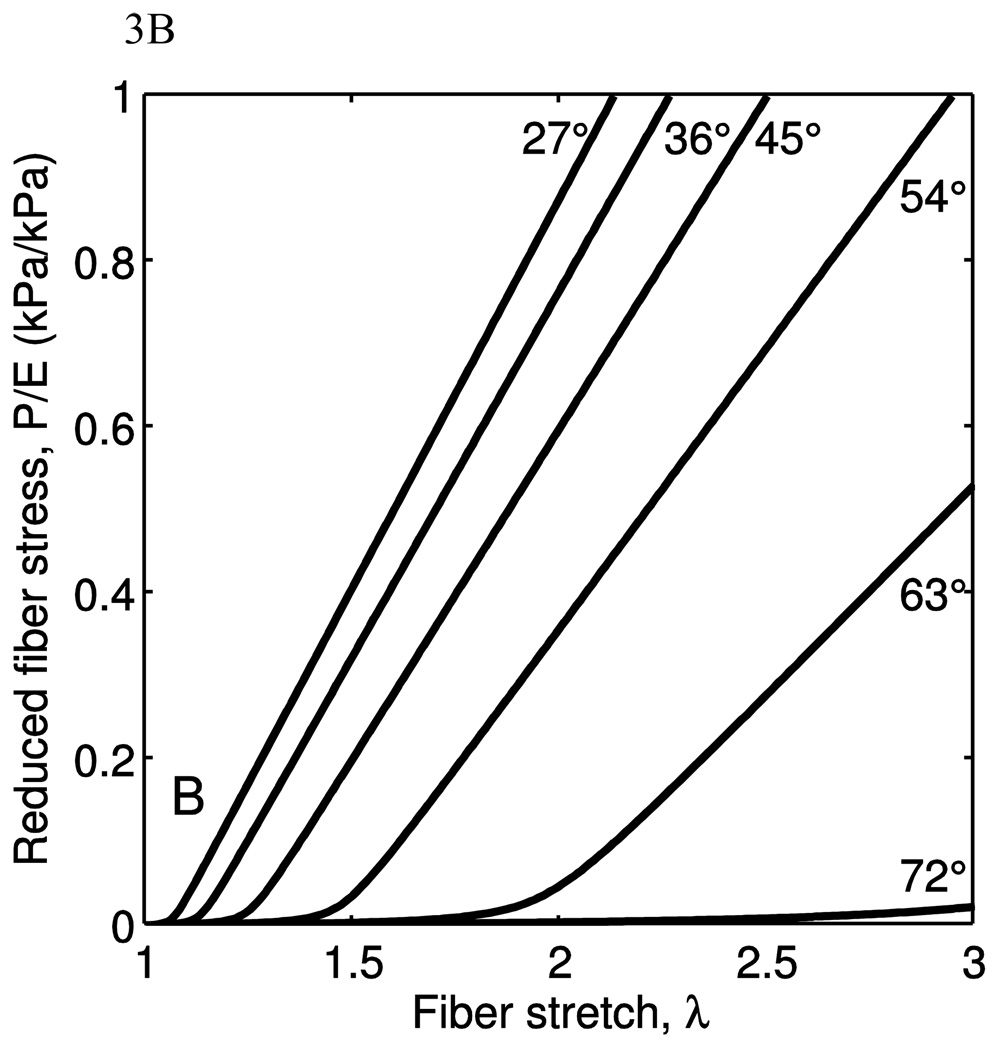
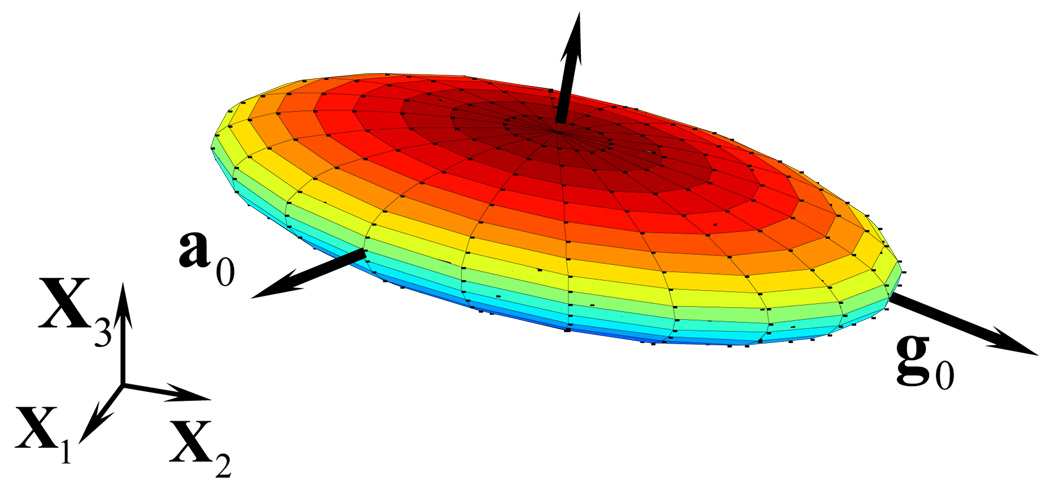
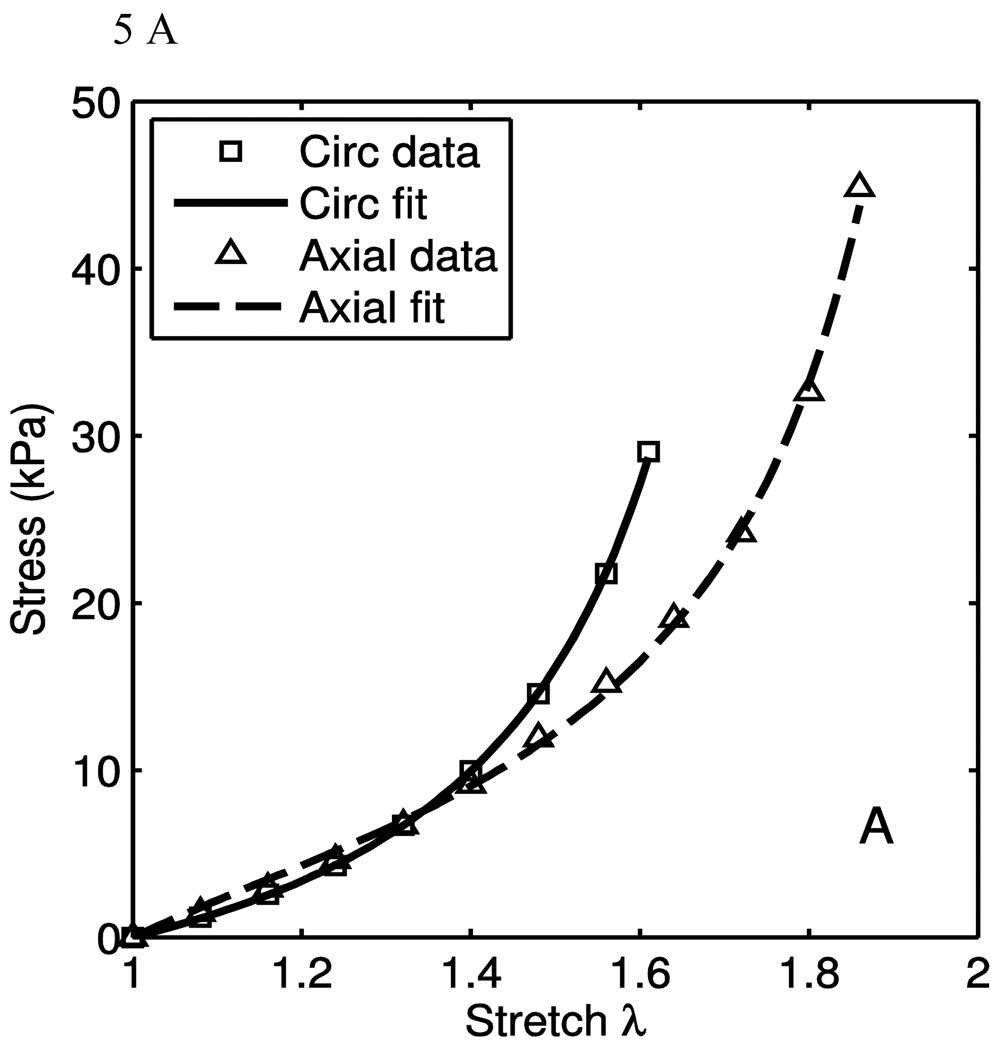
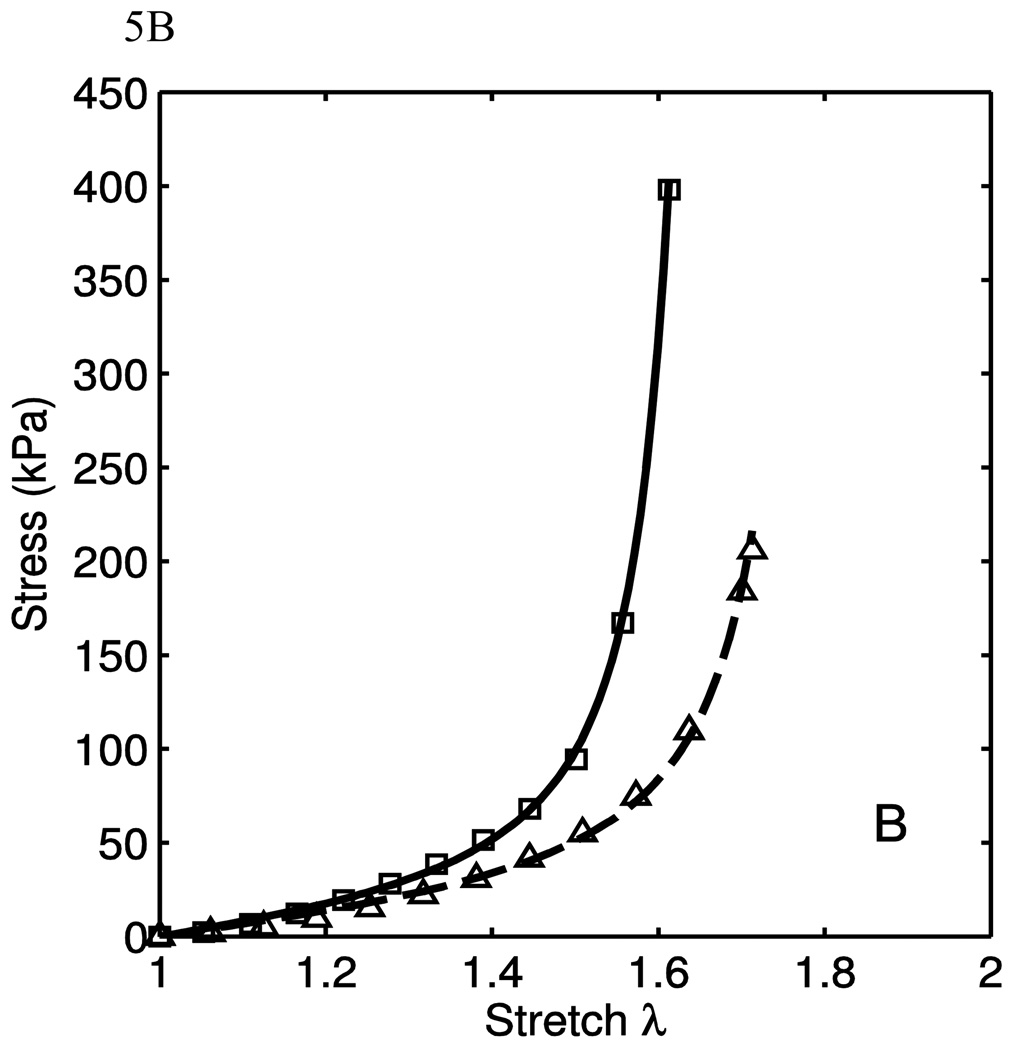
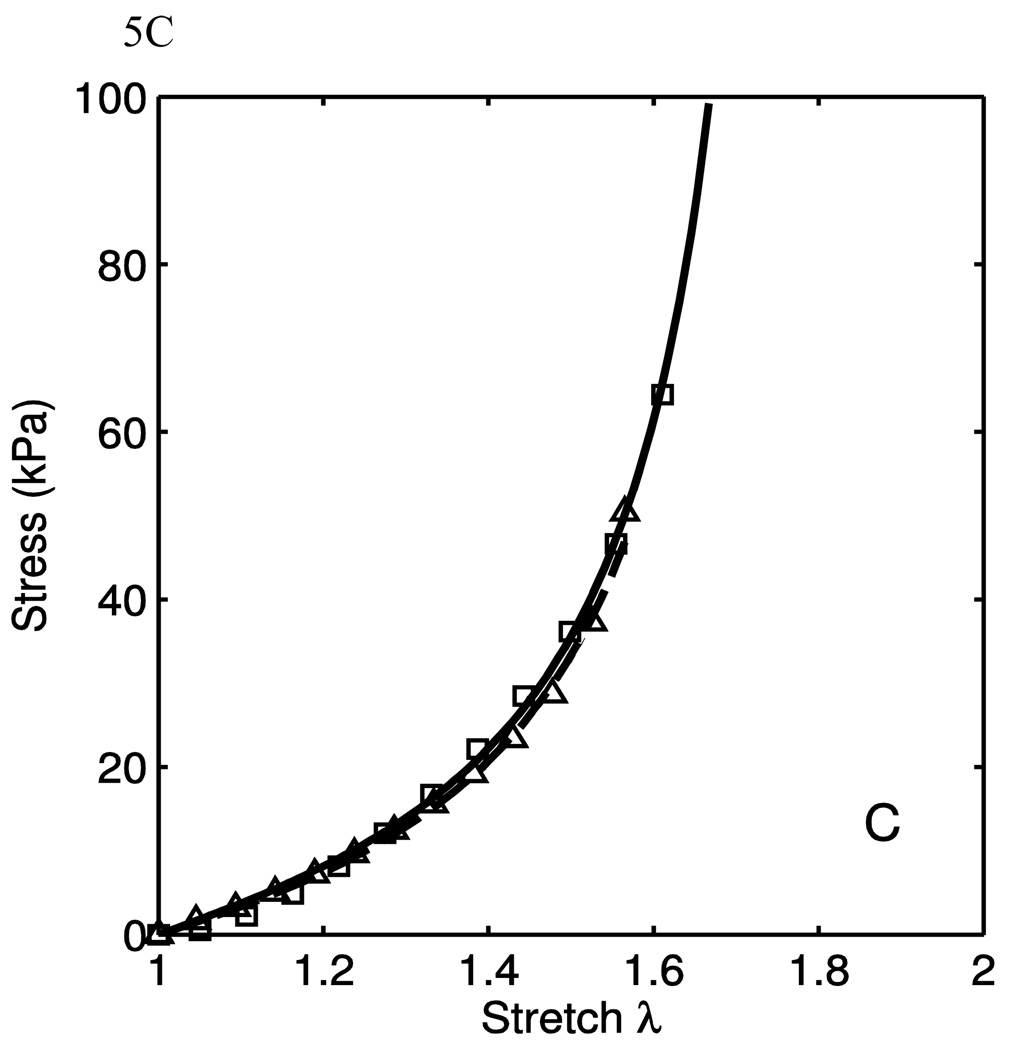
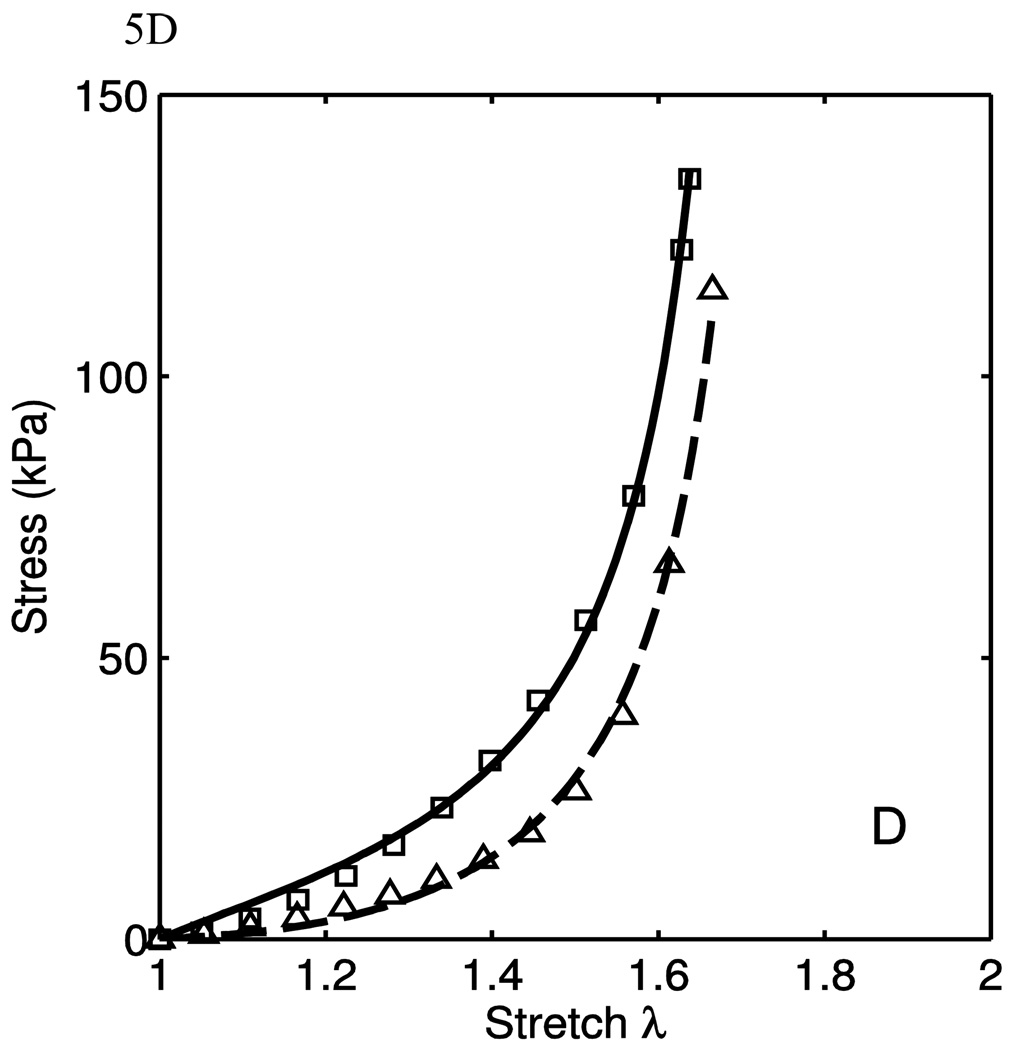
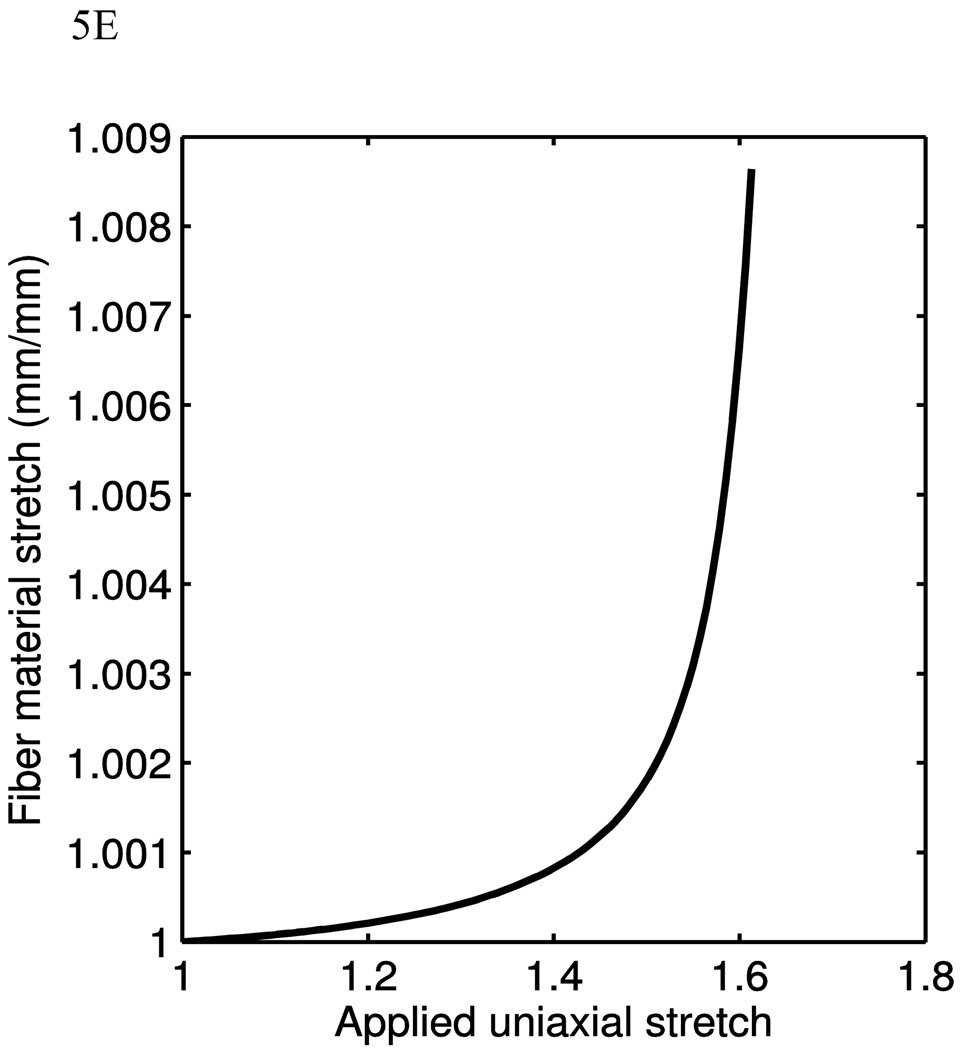
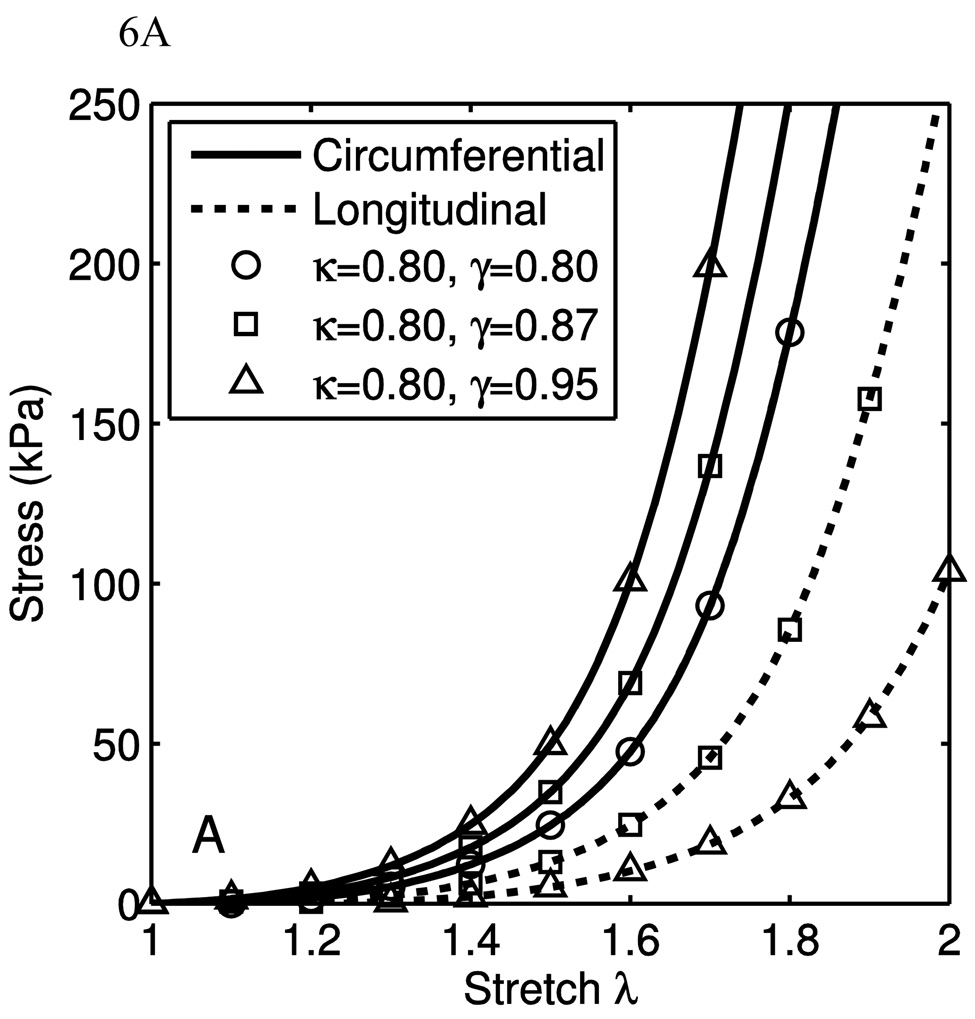
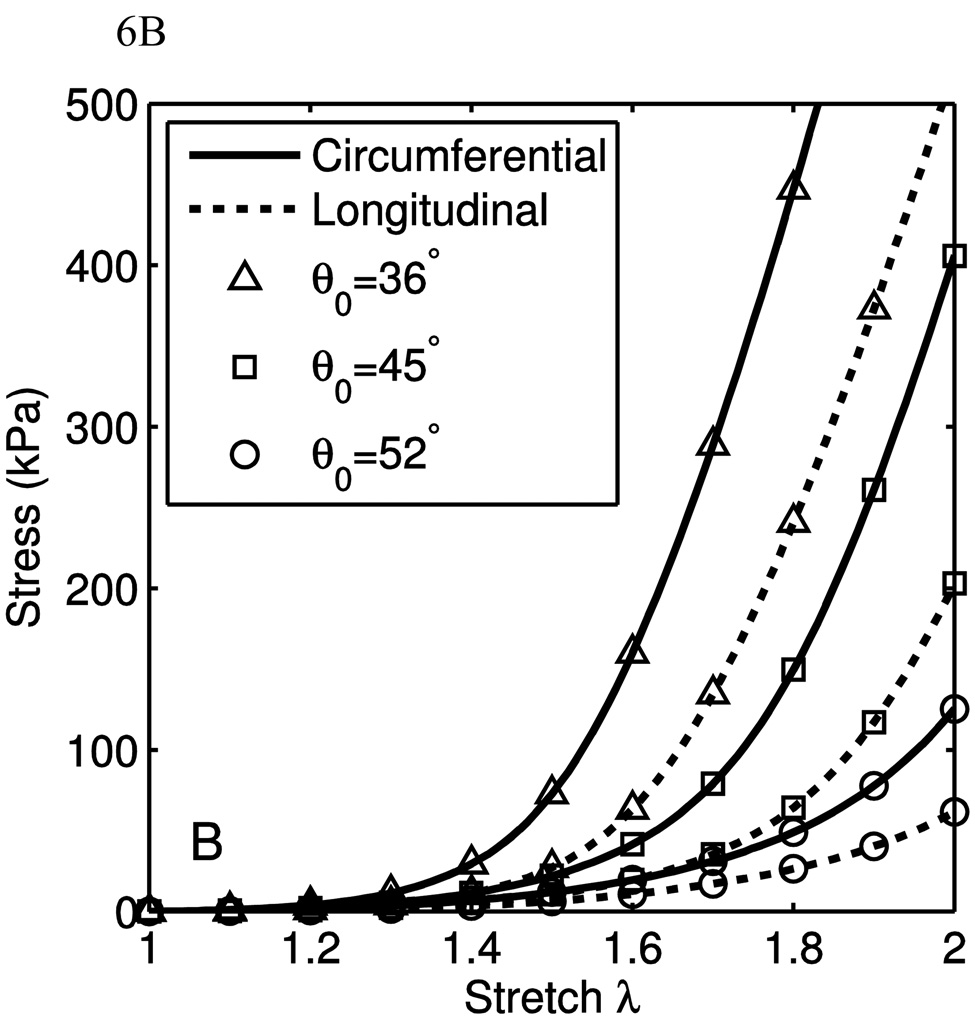
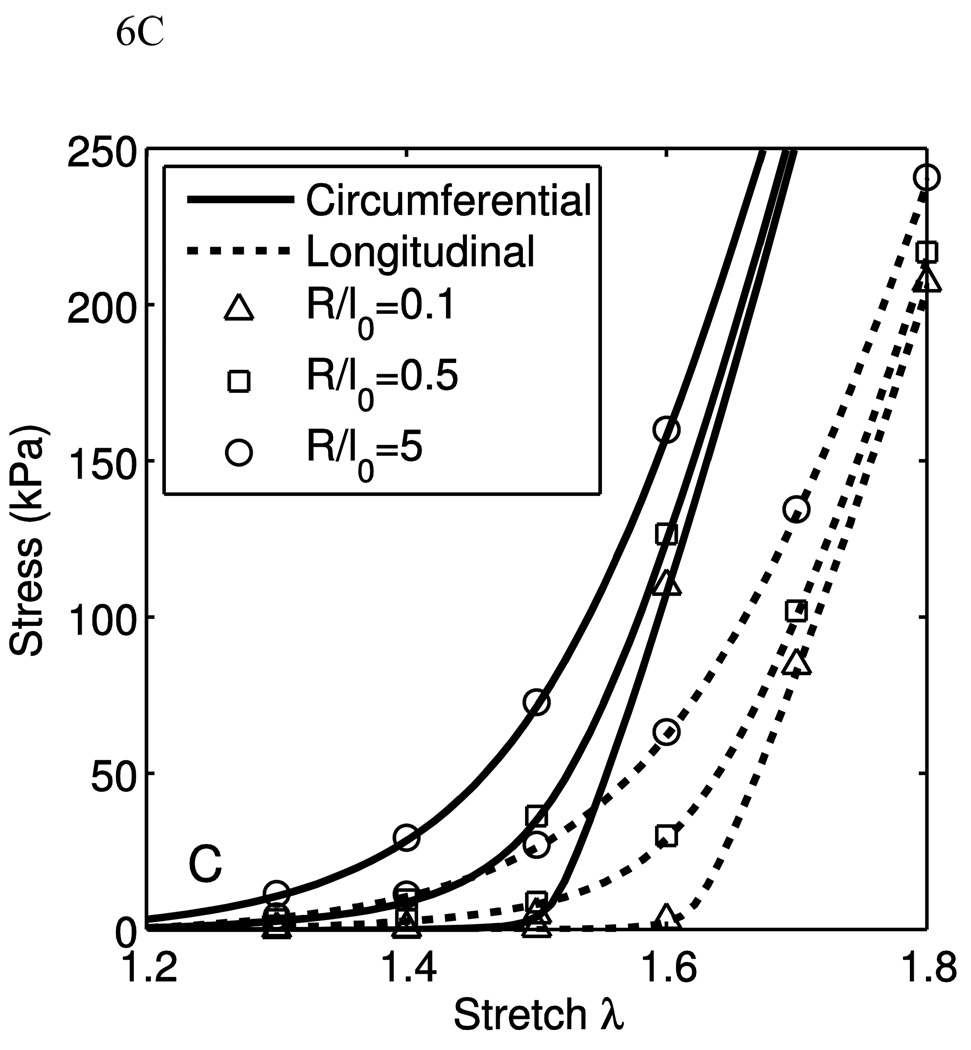
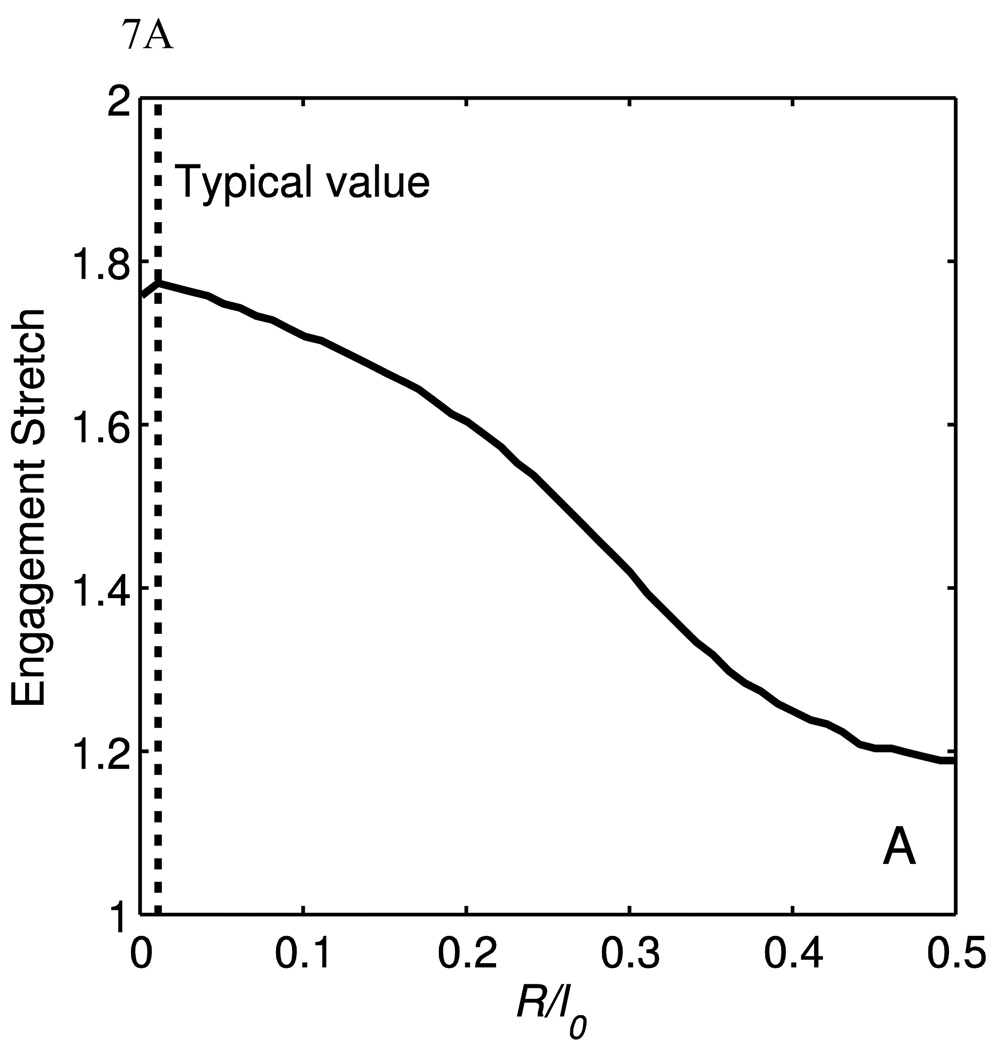
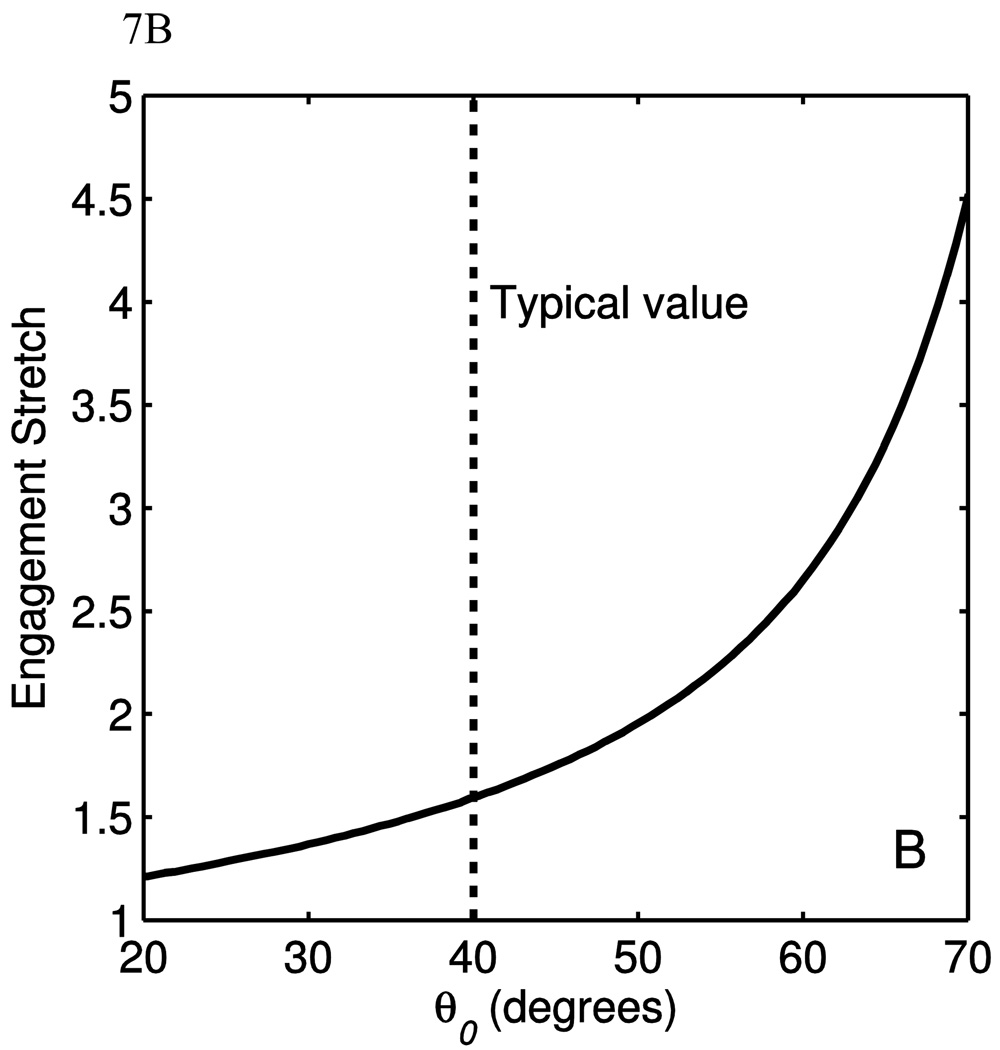
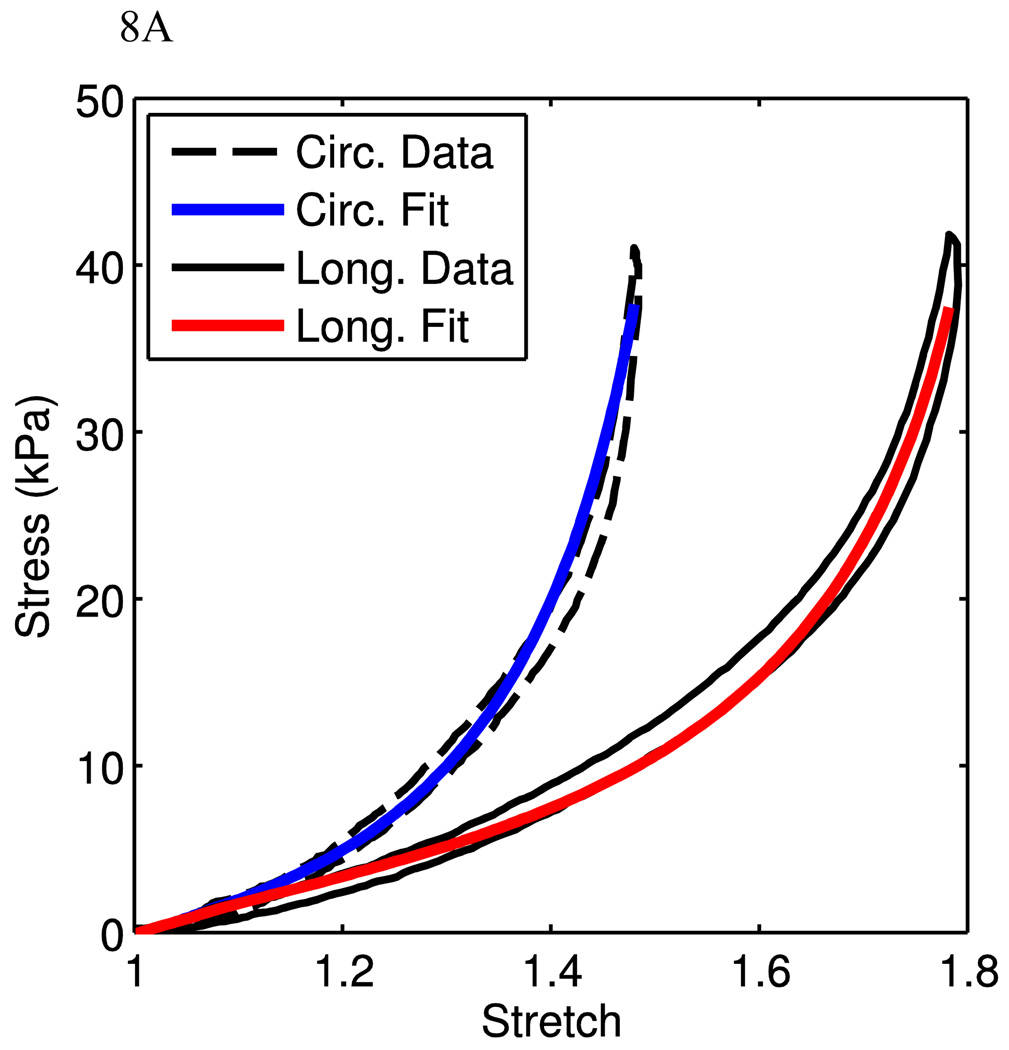
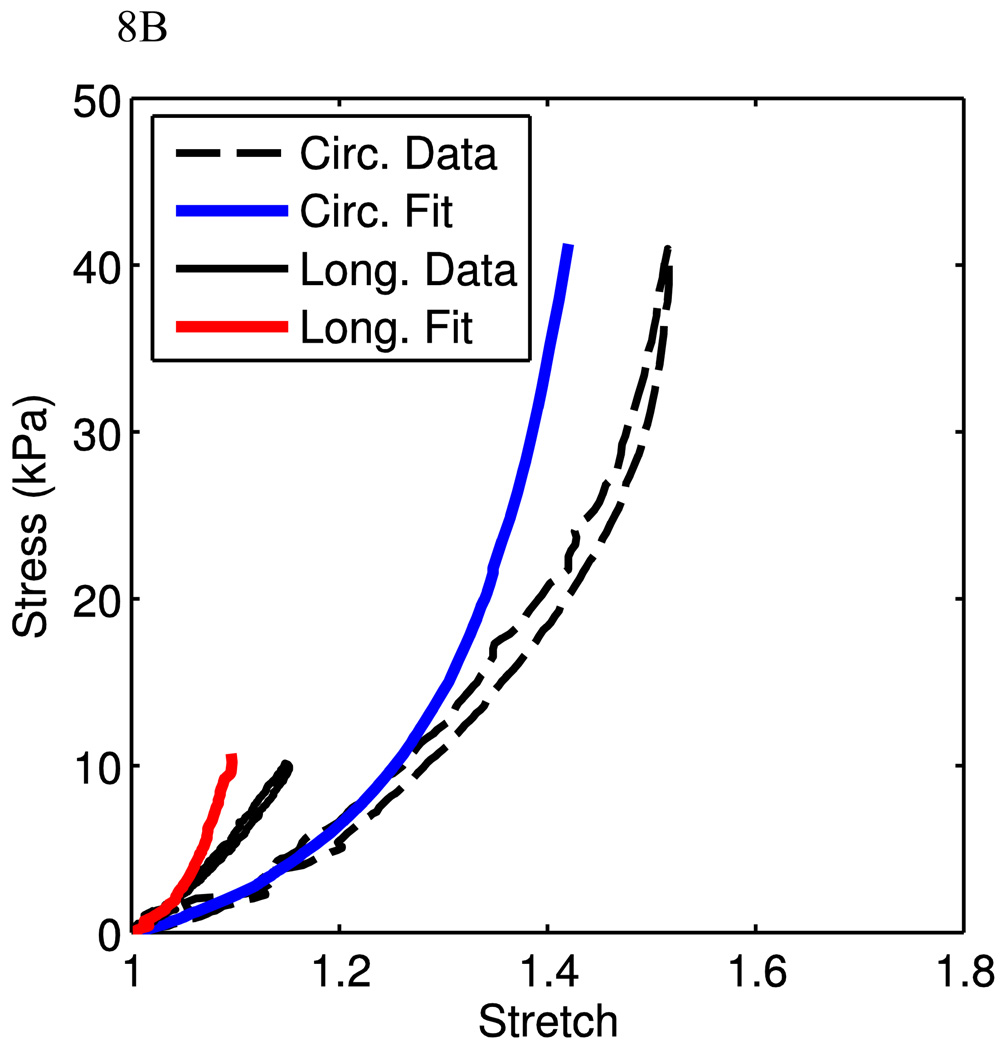
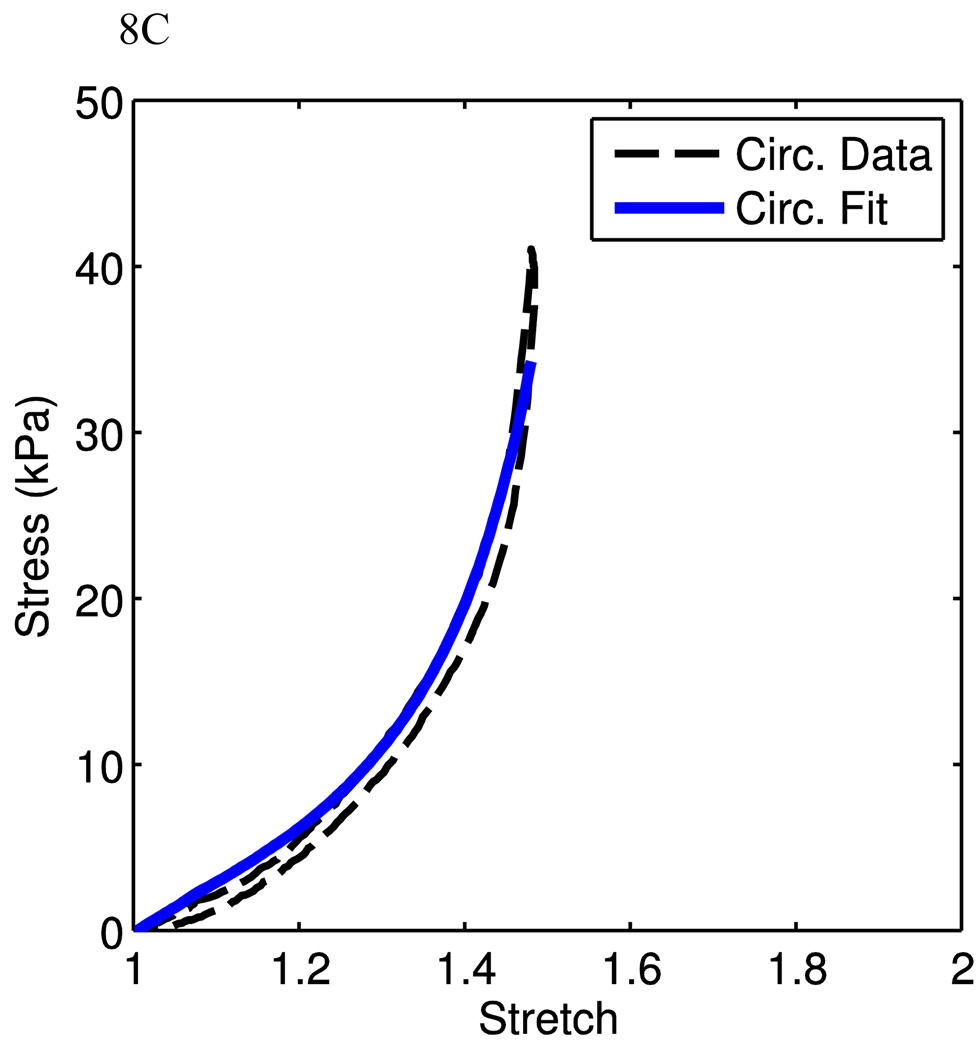
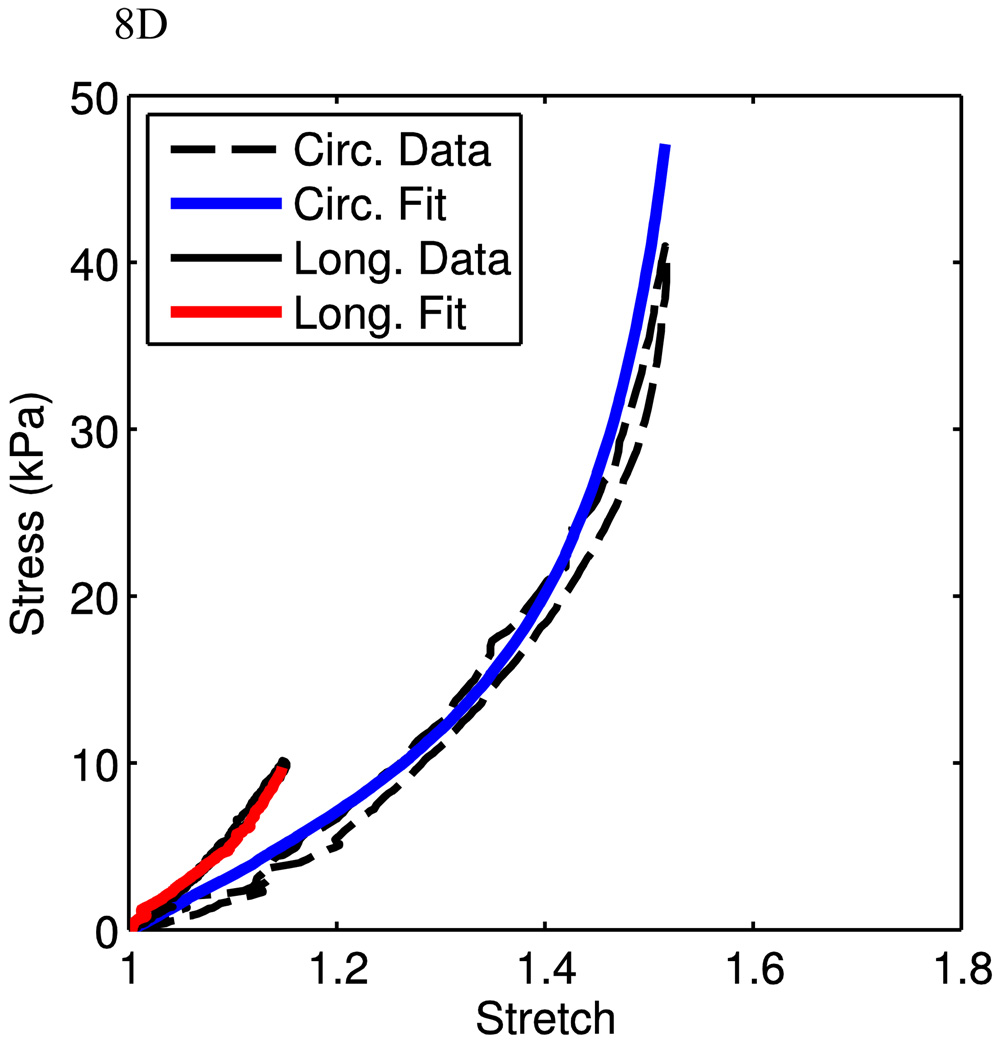
A new constitutive model for elastic, proximal pulmonary artery tissue is presented here, called the total crimped fiber model. This model is based on the material and microstructural properties of the two main, passive, load-bearing components of the artery wall, elastin, and collagen. Elastin matrix proteins are modeled with an orthotropic neo-Hookean material. High stretch behavior is governed by an orthotropic crimped fiber material modeled as a planar sinusoidal linear elastic beam, which represents collagen fiber deformations. Collagen-dependent artery orthotropy is defined by a structure tensor representing the effective orientation distribution of collagen fiber bundles. Therefore, every parameter of the total crimped fiber model is correlated with either a physiologic structure or geometry or is a mechanically measured material property of the composite tissue. Further, by incorporating elastin orthotropy, this model better represents the mechanics of arterial tissue deformation. These advancements result in a microstructural total crimped fiber model of pulmonary artery tissue mechanics, which demonstrates good quality of fit and flexibility for modeling varied mechanical behaviors encountered in disease states.


Figures

Figure 1
Figure 1
Schematic of strips taken from excised pulmonary arteries.
Figure 2
Figure 2
Schematic of crimped fiber model. The solid line is the undeformed fiber configuration and the dotted line is the deformed fiber configuration.
Figure 3
Figure 3
The behavior of a single fiber under uniaxial extension is plotted. The nominal fiber stress, P is normalized by the Young’s modulus to give the reduced fiber stress. A) As the bending stiffness, via R/l0, is increased, the fiber behavior goes from a sharp engagement to a broad engagement. The shape of the fiber is held constant at θ̅0=54°. B) As the shape, via θ̅0, is increased, the fiber behavior goes from a sharp transition with some fully-developed stiffness to a broad transition with lower fully-developed stiffness. The stretch at which the transition occurs also increases with increasing θ̅0. The radius of gyration ratio is kept constant where R/l0 =0.05.
Figure 3
Figure 3
The behavior of a single fiber under uniaxial extension is plotted. The nominal fiber stress, P is normalized by the Young’s modulus to give the reduced fiber stress. A) As the bending stiffness, via R/l0, is increased, the fiber behavior goes from a sharp engagement to a broad engagement. The shape of the fiber is held constant at θ̅0=54°. B) As the shape, via θ̅0, is increased, the fiber behavior goes from a sharp transition with some fully-developed stiffness to a broad transition with lower fully-developed stiffness. The stretch at which the transition occurs also increases with increasing θ̅0. The radius of gyration ratio is kept constant where R/l0 =0.05.
Figure 4
Figure 4
The visualized ellipsoidal structure tensor. This is generated by observing how the structure tensor transforms a unit vector. A longer dimension indicates a higher concentration of fibers in that direction. Note here that a0 and g0 are not aligned with the global coordinate system, but in the model, are fixed to the circumferential and longitudinal directions respectively.
Figure 5
Figure 5
The data from four sets of uniaxial tests and their corresponding model fits. Squares and triangles denote circumferential and axial data respectively, while Solid and dashed lines denote circumferential and axial data fits. Here it is seen that the model’s versatility in different situations of material behaviors (A–D). E) Fiber material stretch as a function of material stretch for the case of circumferential test in Fig. 5B.
Figure 5
Figure 5
The data from four sets of uniaxial tests and their corresponding model fits. Squares and triangles denote circumferential and axial data respectively, while Solid and dashed lines denote circumferential and axial data fits. Here it is seen that the model’s versatility in different situations of material behaviors (A–D). E) Fiber material stretch as a function of material stretch for the case of circumferential test in Fig. 5B.
Figure 6
Figure 6
A) A parametric study varying γ, with κ = 0.8. It is seen that when κ = γ, (shown in circles), the behavior is transversely isotropic; the uniaxial stress-stretch curves lay on top of one another. As γ is increased in relation to κ, shown in squares (γ = 0.95) and triangles (γ = 0.9), the degree of anisotropy is increased. The circumferential directions are in solid lines and the longitudinal directions are in dotted lines. The parameters held constant are KA=8×10⁻⁴, E=10GPa, θ̅0=45°, R/l0 =0.1. B) Results for the crimped fiber model only, showing the effect of changing crimped fiber parameter θ̅0. As θ̅0 increases, it pushes the engagement strain of the collagen further out. It also decreases the stiffness, as the contour length is increased. The parameters held constant are KA=8×10⁻⁴, E=10GPa, R/l0 =0.1, κ=0.90 and γ=0.95. C) The effect of changing crimped fiber parameter R/l0. As the radius of gyration is changed, it causes the transition to broaden and become more gradual. The parameters held constant are KA=8×10⁻⁴, E=10GPa, θ̅0=36°, κ=0.90 and γ=0.95.
Figure 6
Figure 6
A) A parametric study varying γ, with κ = 0.8. It is seen that when κ = γ, (shown in circles), the behavior is transversely isotropic; the uniaxial stress-stretch curves lay on top of one another. As γ is increased in relation to κ, shown in squares (γ = 0.95) and triangles (γ = 0.9), the degree of anisotropy is increased. The circumferential directions are in solid lines and the longitudinal directions are in dotted lines. The parameters held constant are KA=8×10⁻⁴, E=10GPa, θ̅0=45°, R/l0 =0.1. B) Results for the crimped fiber model only, showing the effect of changing crimped fiber parameter θ̅0. As θ̅0 increases, it pushes the engagement strain of the collagen further out. It also decreases the stiffness, as the contour length is increased. The parameters held constant are KA=8×10⁻⁴, E=10GPa, R/l0 =0.1, κ=0.90 and γ=0.95. C) The effect of changing crimped fiber parameter R/l0. As the radius of gyration is changed, it causes the transition to broaden and become more gradual. The parameters held constant are KA=8×10⁻⁴, E=10GPa, θ̅0=36°, κ=0.90 and γ=0.95.
Figure 7
Figure 7
The engagement stretch as a function of (A) R/l0 and (B) θ̅0. The parameters used to calculate these data are μ = μa = μg =5kPa, KA=12×10−4, E=10GPa, θ̅0 =45°, κ=0.90 and γ=0.95. The dotted lines denote typical parameter values.
Figure 7
Figure 7
The engagement stretch as a function of (A) R/l0 and (B) θ̅0. The parameters used to calculate these data are μ = μa = μg =5kPa, KA=12×10−4, E=10GPa, θ̅0 =45°, κ=0.90 and γ=0.95. The dotted lines denote typical parameter values.
Figure 8
Figure 8
Fits from planar biaxial data. A) Uniaxial stress-stretch data from the planar biaxial tests are shown with corresponding model fits. B) The stress-stretch data from the 100:25 (C:L) experiment is shown with corresponding model prediction, using parameters from the uniaxial fits. C,D) Data and corresponding fit for circumferential uniaxial (C) and 100:25 (C:L) tests (D).
Figure 8
Figure 8
Fits from planar biaxial data. A) Uniaxial stress-stretch data from the planar biaxial tests are shown with corresponding model fits. B) The stress-stretch data from the 100:25 (C:L) experiment is shown with corresponding model prediction, using parameters from the uniaxial fits. C,D) Data and corresponding fit for circumferential uniaxial (C) and 100:25 (C:L) tests (D).

References

    1. Hunter KS, Lee PF, Lanning CJ, Ivy DD, Kirby KS, Claussen LR, Chan KC, Shandas R. Pulmonary vascular input impedance is a combined measure of pulmonary vascular resistance and stiffness and predicts clinical outcomes better than pulmonary vascular resistance alone in pediatric patients with pulmonary hypertension. American Heart Journal. 2008;155(1):166–174. - PMC - PubMed
    1. Humphrey JD. Cardiovascular solid mechanics : cells, tissues, and organs. New York: Springer; 2002.
    1. Lammers SR, Kao PH, Qi HJ, Hunter K, Lanning C, Albietz J, Hofmeister S, Mecham R, Stenmark KR, Shandas R. Changes in the structure-function relationship of elastin and its impact on the proximal pulmonary arterial mechanics of hypertensive calves. Am. J. Physiol.-Heart Circul. Physiol. 2008;295(4):H1451–H1459. - PMC - PubMed
    1. Jacob MP. Extracellular matrix remodeling and matrix metalloproteinases in the vascular wall during aging and in pathological conditions. Biomed. Pharmacother. 2003;57(5–6):195–202. - PubMed
    1. Patel DJ, Fry DL. Elastic Symmetry of Arterial Segments in Dogs. Circulation Research. 1969;24(1) pp. 1-&. - PubMed

Publication types