. 2011 Apr;83(4 Pt 1):041920.
doi: 10.1103/PhysRevE.83.041920. Epub 2011 Apr 25.

Acoustic signatures of sound source-tract coupling

Affiliations

Acoustic signatures of sound source-tract coupling

Ezequiel M Arneodo et al. Phys Rev E Stat Nonlin Soft Matter Phys. 2011 Apr.

Abstract

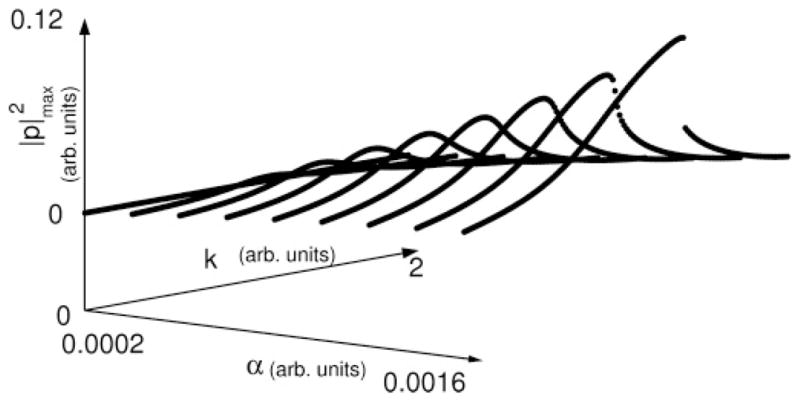
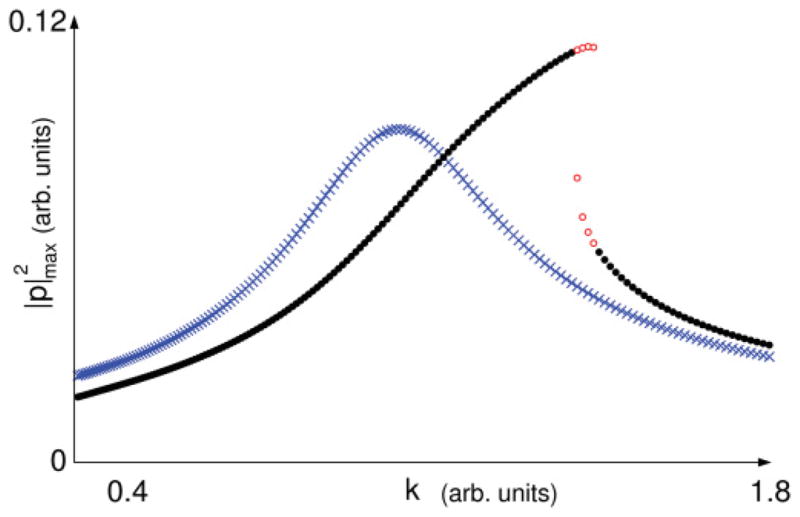
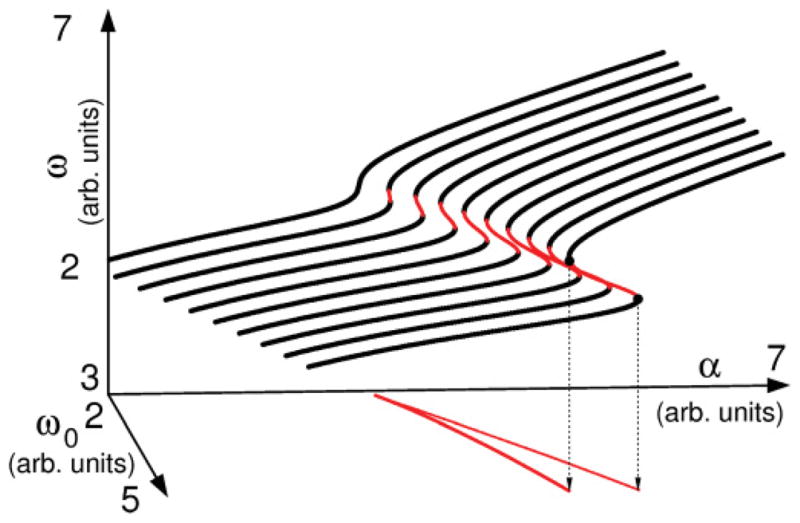
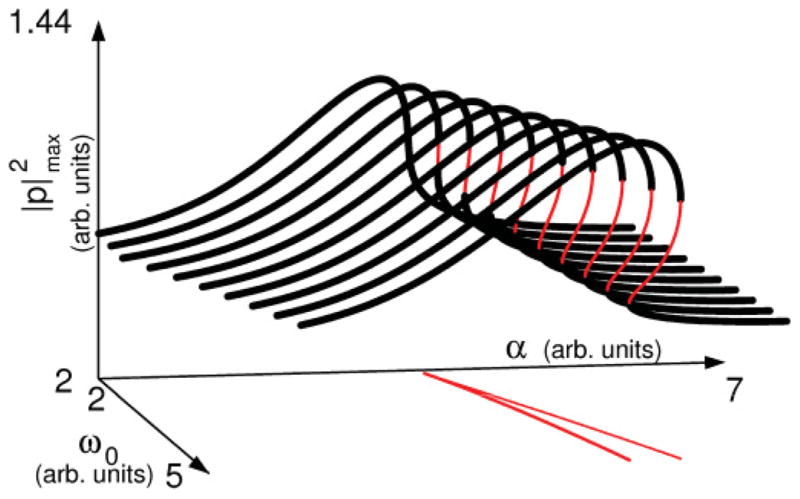
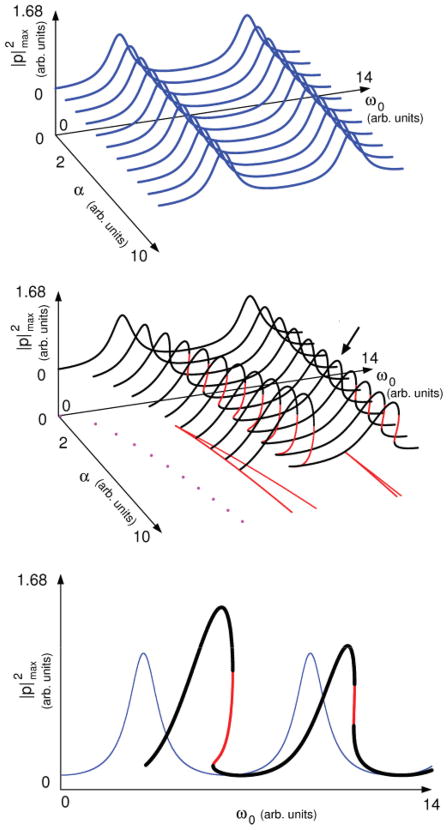
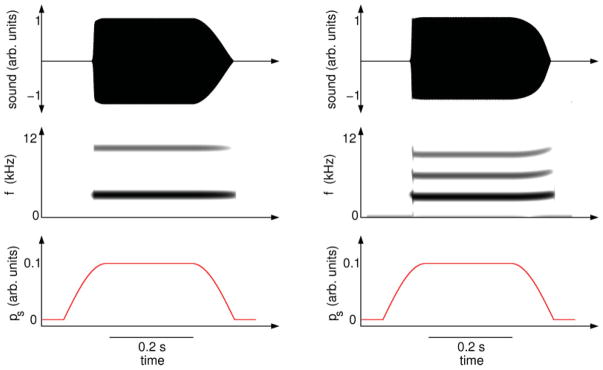
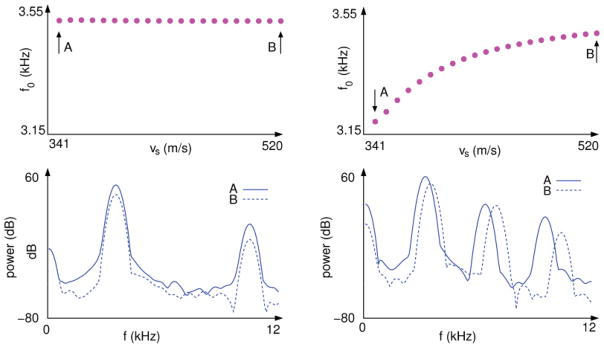
Birdsong is a complex behavior, which results from the interaction between a nervous system and a biomechanical peripheral device. While much has been learned about how complex sounds are generated in the vocal organ, little has been learned about the signature on the vocalizations of the nonlinear effects introduced by the acoustic interactions between a sound source and the vocal tract. The variety of morphologies among bird species makes birdsong a most suitable model to study phenomena associated to the production of complex vocalizations. Inspired by the sound production mechanisms of songbirds, in this work we study a mathematical model of a vocal organ, in which a simple sound source interacts with a tract, leading to a delay differential equation. We explore the system numerically, and by taking it to the weakly nonlinear limit, we are able to examine its periodic solutions analytically. By these means we are able to explore the dynamics of oscillatory solutions of a sound source-tract coupled system, which are qualitatively different from those of a sound source-filter model of a vocal organ. Nonlinear features of the solutions are proposed as the underlying mechanisms of observed phenomena in birdsong, such as unilaterally produced "frequency jumps," enhancement of resonances, and the shift of the fundamental frequency observed in heliox experiments.


Figures

FIG. 1
FIG. 1
Sound amplitude against k for different values of the coupling coefficient α. As the coupling increases, the amplitude at the resonance grows. For large enough α, a coexistence region sets in, where two oscillatory solutions with different amplitudes are possible. Parameters used for numerical integration were (γ, ps, β, c, r) = (7000π, 0.1, 0.01, 1 × 10⁻⁶, 0.71) in dimensionless units, τ = 1.43 × 10⁻⁴ s.
FIG. 2
FIG. 2
(Color online) Detail of sound amplitude against k and comparison with the source-filter uncoupled system. Crosses represent the amplitude of sounds originated in a source-filter system. Dots represent sounds generated in the source-tract coupled system. Empty dots highlight the region of coexistence of periodic solutions: At those values of k, the amplitude of the sound will be either of two values, depending on the initial conditions. Parameters used for numerical integration were (γ, ps, β, c, r, α) = (7000π, 0.1, 0.01, 1 × 10⁻⁶, 0.71, 0.0014) in dimensionless units, τ = 1.43 × 10⁻⁴ s.
FIG. 3
FIG. 3
(Color online) Angular frequencies of fixed points of system (6). The dark bold lines indicate stable fixed points, where condition (8) is met and gω>0. Thinner, lighter lines indicate unstable fixed points, at which gω<0. The lines in the (α, ω0) plane delimit the region of coexistence of fixed points. On these lines gω=0, indicating the occurrence of saddle-node bifurcations of fixed points. The point where they meet is where a cusp bifurcation occurs: that is, the critical value for (α, ω0) at which coexistence is possible. Parameters used were (ps, β, r, τ) = (5.1, 0.1, 0.51, 1.0) in dimensionless units.
FIG. 4
FIG. 4
(Color online) Sound amplitude of stationary oscillatory solutions. The dark, bold lines indicate stable oscillatory solutions. Thinner, lighter lines indicate unstable limit cycles. The lines in the (α, ω0) plane delimit the region of coexistence of fixed points. On these lines, gω=0 indicating the occurrence of saddle-node bifurcations of fixed points. The point where they meet is where a cusp bifurcation occurs. Parameters used were the same as in Fig 3.
FIG. 5
FIG. 5
(Color online) Amplitudes (squared, per unit α) of sounds originated in source-filter and source-tract coupled systems. Sounds coming out of a source-filter system (top panel). Sounds coming out of a source-tract coupled present coexistence of stable solutions. The thick, dark lines represent stable solutions, the thinner, lighter lines indicate unstable solutions. Regions of coexistence of solutions are indicated by the intersecting lines in the (α, ω0) plane. Phonation thresholds are indicated by the dotted line in the (α, ω0) plane (middle panel). Comparison of amplitudes of sounds elicited by both systems for α = 7.0, as indicated by the arrow in the middle panel (lower panel). Parameters used were the same as in Fig 3.
FIG. 6
FIG. 6
(Color online) Synthetic vocalizations produced by numerical integration of Eqs. (1) and (2), considering source-filter independence (left panels) and source-tract interaction (right panels). Sound (top panels) is produced when the system is driven by a simple pressure gesture (bottom panels). The sonograms (middle panels) show that the spectral content of the vocalizations are qualitatively different. Parameters used for numerical integration were (γ, β, c, r, α) = (7000π, 0.01, 1 × 10⁻⁶, 0.71, 0.0014) in dimensionless units, τ = 1.43 × 10⁻⁴ s.
FIG. 7
FIG. 7
(Color online) Fundamental frequencies of synthetic vocalizations and power spectrum for varying medium density. Fundamental frequencies of sounds do not change with the air density if the source and the filter do not interact (top left panel). When the source is coupled to the tract, there is a drift in the fundamental frequency (top right panel). The arrows A and B in the upper panels indicate two different air densities, at which the power spectra of the synthetic sounds were computed (bottom panels). The power spectrum of the source-filter synthetic sound changes only the relative values between the resonance peaks when the density of the air is changed (bottom left panel), whereas a shift is observed in the peaks of the source-filter vocalizations (bottom right panel). Parameters used for numerical integration were (γ, β, c, r, α) = (7000π, 0.01, 1 × 10⁻⁶, 0.71, 0.0014) in dimensionless units, τ = 9.6 cm/vs.

References

    1. Zeigler P, Marler P. Neuroscience of Birdsong. Cambridge University Press; Cambridge, MA: 2004.
    1. Doupe AJ, Kuhl PK. Annu Rev Neurosci. 1999;22:567. - PubMed
    1. Goller F, Cooper BG. Ann NY Acad Sci. 2004;1016:130. - PubMed
    1. Mindlin G, Laje R. The Physics of Birdsong. Springer; Berlin: 2005.
    1. Larsen ON, Goller F. Proc Biol Sci. 1999;266:1609.

LinkOut - more resources