. 2011 May 20:11:112.
doi: 10.1186/1471-2180-11-112.

Comparisons of resistance of CF and non-CF pathogens to hydrogen peroxide and hypochlorous acid oxidants in vitro

Affiliations

Comparisons of resistance of CF and non-CF pathogens to hydrogen peroxide and hypochlorous acid oxidants in vitro

Ryan W Bonvillain et al. BMC Microbiol. .

Abstract

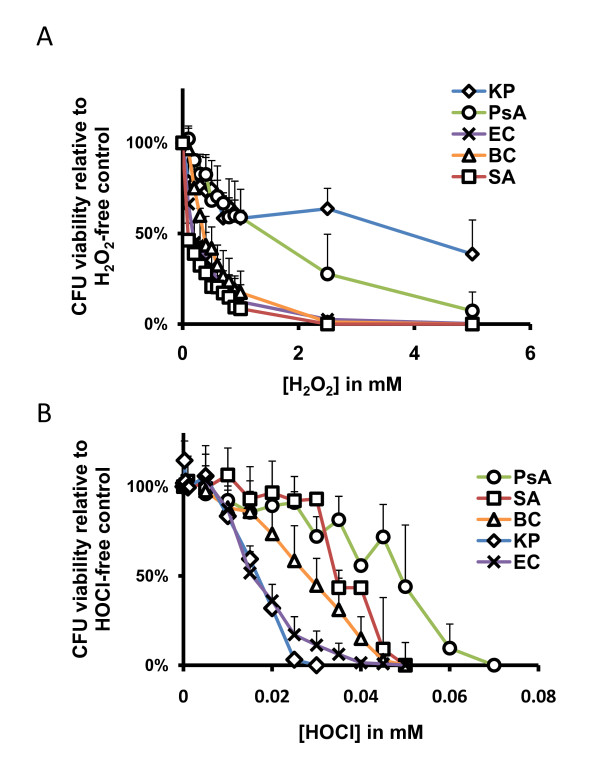
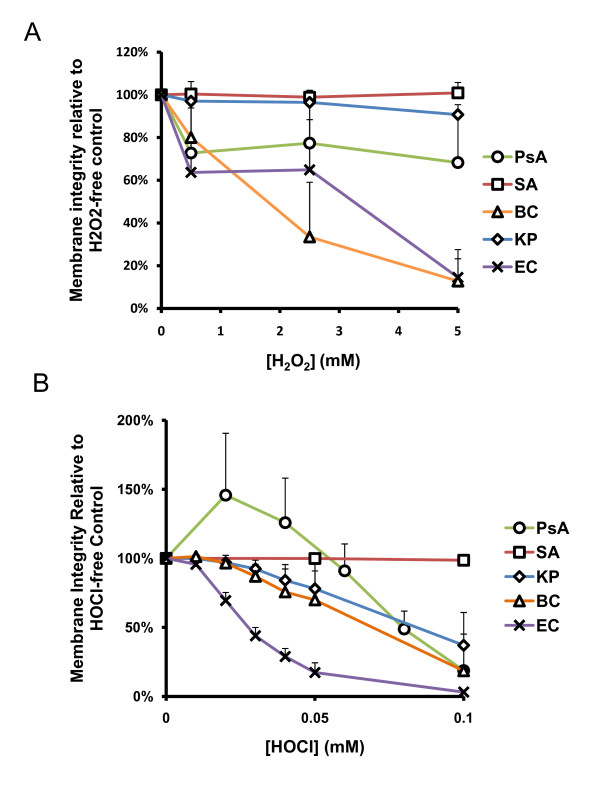
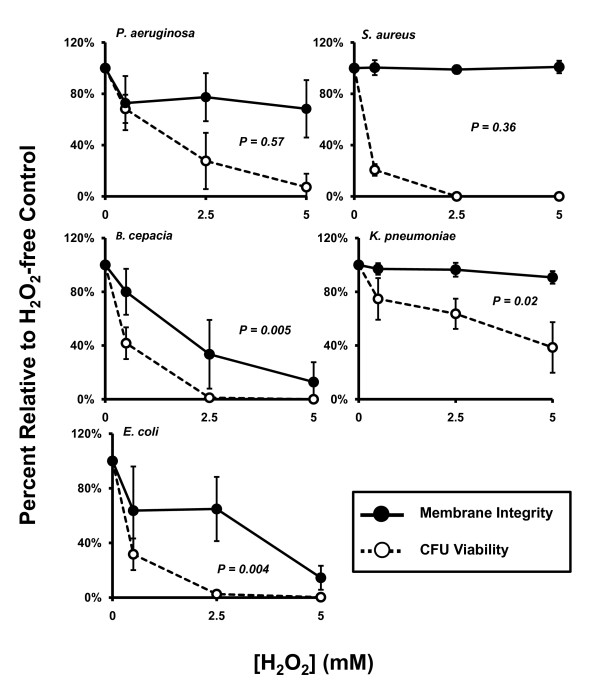
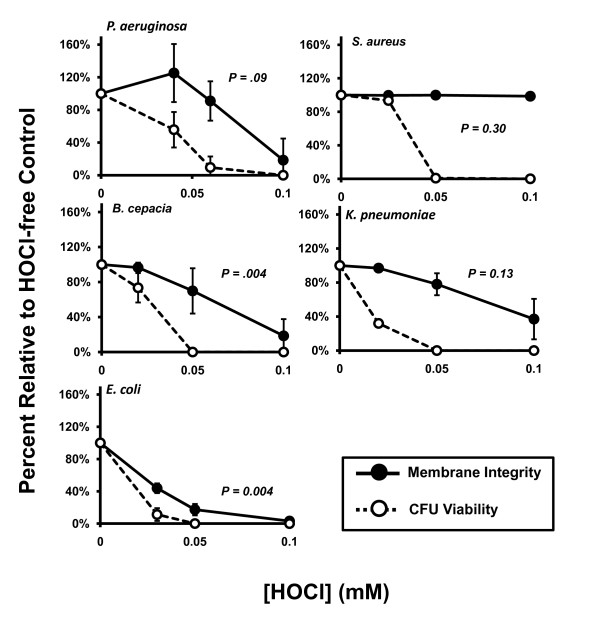
Background: Cystic fibrosis (CF) lung disease has a unique profile of pathogens predominated by Pseudomonas aeruginosa (PsA) and Staphylococcus aureus (SA). These microorganisms must overcome host immune defense to colonize the CF lungs. Polymorphonuclear neutrophils are a major component of the host defense against bacterial infection. A crucial microbicidal mechanism is the production of oxidants including hydrogen peroxide (H2O2) and hypochlorous acid (HOCl) by neutrophils to achieve efficient bacterial killing. To determine to what degrees various CF pathogens resist the oxidants relative to non-CF pathogens, we compared the susceptibility of PsA, SA, Burkholderia cepacia (BC), Klebsiella pneumoniae (KP), and Escherichia coli (EC) to various concentrations of H2O2 or HOCl, in vitro. The comparative oxidant-resistant profiles were established. Oxidant-induced damage to ATP production and cell membrane integrity of the microbes were quantitatively assessed. Correlation of membrane permeability and ATP levels with bacterial viability was statistically evaluated.

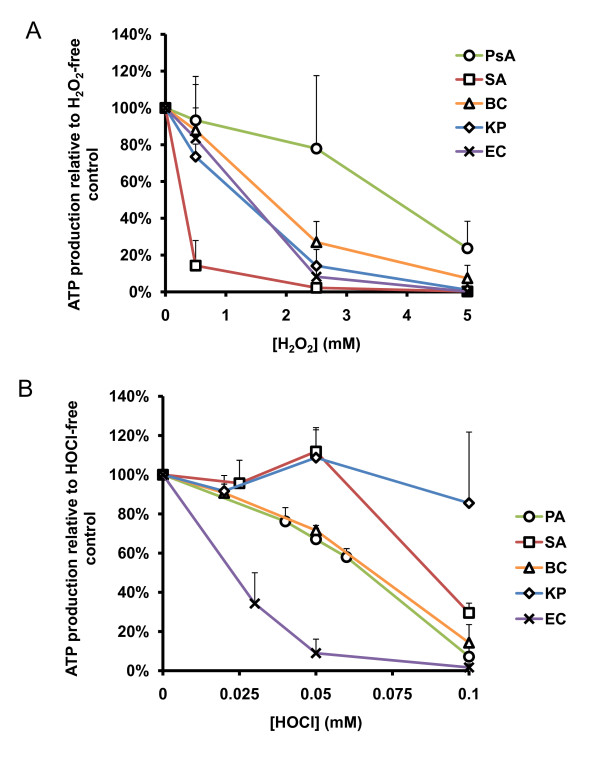
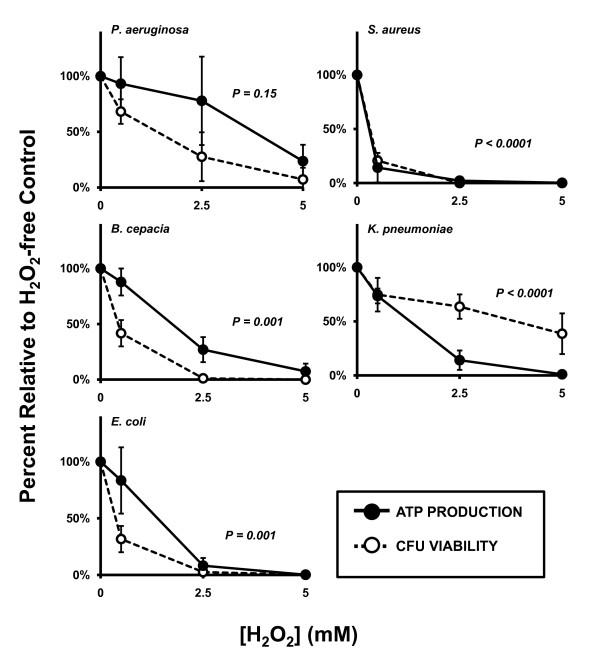
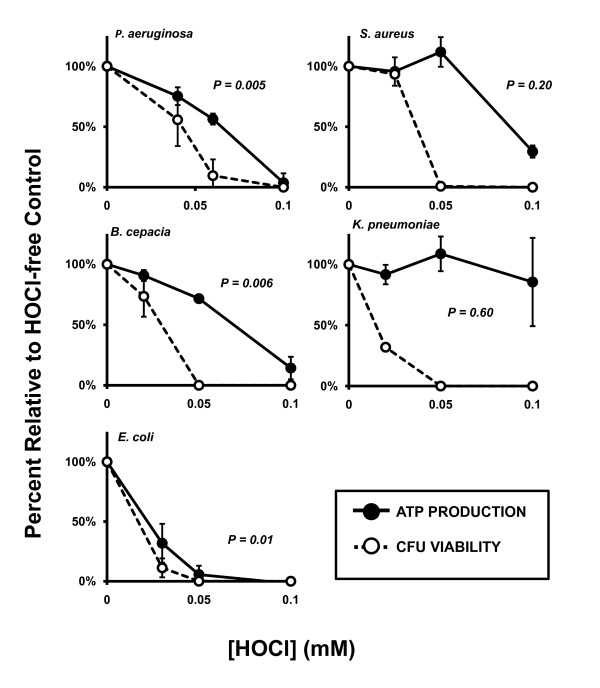
Results: PsA was relatively resistant to both H2O2 (LD50 = 1.5 mM) and HOCl (LD50 = 0.035 mM). SA was susceptible to H2O2 (LD50 = 0.1 mM) but resistant to HOCl (LD50 = 0.035 mM). Interestingly, KP was extremely resistant to high doses of H2O2 (LD50 = 2.5-5.0 mM) but was very sensitive to low doses of HOCl (LD50 = 0.015 mM). BC was intermediate to resist both oxidants: H2O2 (LD50 = 0.3-0.4 mM) and HOCl (LD50 = 0.025 mM). EC displayed the least resistance to H2O2 (LD50 = 0.2-0.3 mM) and HOCl (LD50 = 0.015 mM). The identified profile of H2O2-resistance was KP > PsA > BC > EC > SA and the profile of HOCl-resistance PsA > SA > BC > EC > KP. Moreover, both oxidants affected ATP production and membrane integrity of the cells. However, the effects varied among the tested organisms and, the oxidant-mediated damage correlated differentially with the bacterial viability.

Conclusions: The order of HOCl-resistance identified herein best fits the clinical profile of CF infections. Even though oxidants are able to disrupt ATP production and cell membrane integrity, the degrees of damage vary among the organisms and correlate differentially with their viability.


Figures

Figure 1
Figure 1
Bacterial killing by reagent H2O2 and HOCl in vitro. Microbes were exposed to various concentrations of H2O2 or HOCl, as indicated, for 1 hour at 37°C. At the end of the exposure, the samples were plated to LB agar plates for overnight culture. Bacterial killing by oxidants was measured as percent of viable bacteria relative to the number of colonies from the oxidant-free controls. A) Organisms indicated were exposed to 0 mM to 5.0 mM H2O2 or (B) 0 mM to 0.1 mM HOCl. PsA = P. aeruginosa, SA = S. aureus, BC = B. cepacia, KP = K. pneumoniae, and EC = DH5α-E. coli. Error bars represent standard deviation of at least n = 3 experiments.
Figure 2
Figure 2
H2O2 and HOCl-induced membrane permeability. Bacteria were exposed to reagent A) H2O2 or B) HOCl as indicated, and the effect of the oxidant on membrane integrity was measured by the BacLight Bacterial Viability and Counting Kit (Molecular Probes). Membrane integrity of PsA, SA, and KP were not significantly affected by H2O2 up to 5 mM by single-factor ANOVA analyses. All organisms tested demonstrated HOCl dose-dependent membrane permeability except SA which remained unaffected up to 0.1 mM. Error bars represent standard deviations of at least n = 3 experiments.
Figure 3
Figure 3
Correlating H2O2-mediated membrane permeabilization and CFU viability. For BC, KP, and EC, loss of membrane integrity correlated statistically with decline in CFU viability while these two parameters were statistically independent of each other for PsA and SA. Solid circles and lines: membrane integrity. Open circles and dotted lines: bacterial viability. Both parameters were expressed as percent relative to oxidant-free controls. P-values represent linear regression of the raw data values from membrane permeability versus bacterial viability. Values less than 0.05 were considered significant and denote correlation between the parameters; values greater than 0.05 indicate independence of the parameters. Error bars represent standard deviation of at least n = 3 experiments.
Figure 4
Figure 4
Correlating HOCl-induced membrane permeability and CFU viability. Bacteria were exposed to reagent HOCl in vitro to determine the effect of the oxidant on membrane integrity as measured by the BacLight Bacterial Viability and Counting Kit (Molecular Probes). Concentrations of HOCl used were based on the amounts necessary to eradicate CFU viability as assessed in the previous experiments. In general, bacterial membranes remain intact at concentrations beyond that required to inhibit CFU formation and kill the organism. Under these conditions, PsA, SA, and KP were killed at statistically lower concentrations of HOCl than were required to produce the same degree of membrane permeabilization. Membrane permeabilization by HOCl in BC and EC correlated with loss of CFU viability. Solid circles and lines: membrane integrity. Open circles and dotted lines: bacterial viability. Both parameters were expressed as percent relative to oxidant-free controls. P-values represent linear regression of the raw data values from membrane permeability versus CFU viability. Values less than 0.05 were considered significant and denote correlation among the parameters; values greater than 0.05 indicate independence of the parameters. Error bars represent standard deviation of at least n = 3 experiments.
Figure 5
Figure 5
H2O2- and HOCl-induced ATP changes in bacterial pathogens. Bacteria were exposed to reagent H2O2 or HOCl, in vitro, to determine the effect of the oxidant on ATP production as measured by the BacTiter-Glo Microbial Cell Viability Assay (Promega). Concentrations of oxidants used were based on the amounts necessary to eradicate CFU viability as assessed in the previous experiments. A) All organisms displayed significant reduction in ATP production (One-way ANOVA) in an H2O2 dose-dependent manner up to 5 mM. B) ATP production by KP was statistically unaffected by HOCl exposure up to 0.1 mM according to one-way ANOVA (p = 0.53) while all other organisms tested displayed significant HOCl dose-dependent reduction in ATP production in this concentration range. Error bars represent standard deviation of at least n = 3 experiments.
Figure 6
Figure 6
Correlating H2O2-induced loss of ATP production with bacterial viability. H2O2-induced disruption of ATP production correlated statistically with abolishment of CFU viability for all organisms tested except PsA (p = 0.15) at concentrations up to 5 mM. Though the decline of ATP production in PsA for this oxidant was statistically significant in this range, the percent change remains independent of the percent reduction in CFU viability. Solid circles and lines: ATP recovery after oxidant exposure. Open circles and dotted lines: CFU viability. Both parameters are measured as percent relative to oxidant-free controls. P-values represent linear regression of the raw data values from percent ATP recovery versus CFU viability. Values less than 0.05 were considered significant and denote correlation between the parameters; values greater than 0.05 indicate independence of the parameters. Error bars represent standard deviation of at least n = 3 experiments.
Figure 7
Figure 7
Correlating HOCl-induced ATP changes with bacterial viability. ATP production is affected by HOCl exposure and correlates statistically with CFU viability in PsA, BC, and EC (p = 0.005, 0.006, and 0.01, respectively); however, SA and KP lose CFU viability after exposure to lower concentrations of HOCl than are required to abolish ATP production during the assay time. Solid circles and lines: ATP recovery after oxidant exposure. Open circles and dotted lines: CFU viability. Both parameters are measured as percent relative to oxidant-free controls. P-values represent linear regression of the raw data values from percent ATP recovery versus CFU viability. Values less than 0.05 were considered significant and denote correlation among the parameters; values greater than 0.05 indicate independence of the parameters. Error bars represent standard deviation of at least n = 3 experiments.

References

    1. Collins FS. Cystic fibrosis: molecular biology and therapeutic implications. Science. 1992;256(5058):774–779. doi: 10.1126/science.1375392. - DOI - PubMed
    1. Welsh MJ, Ramsey BW, Accurso F, Cutting G. In: Metabolic and Molecular Basis of Interited Disease. 8. Scriver CR, editor. New York: McGraw-Hill; 2001. Cystic Fibrosis; pp. 5121–5188.
    1. Davis PB, Drumm M, Konstan MW. Cystic fibrosis. Am J Respir Crit Care Med. 1996;154(5):1229–1256. - PubMed
    1. Sadikot RT, Blackwell TS, Christman JW, Prince AS. Pathogen-host interactions in Pseudomonas aeruginosa pneumonia. Am J Respir Crit Care Med. 2005;171(11):1209–1223. doi: 10.1164/rccm.200408-1044SO. - DOI - PMC - PubMed
    1. Foundation CF. Cystic Fibrosis Foundation Patient Rigestry: 2009 Annual Data Report. http://www.cff.org/UploadedFiles/research/ClinicalResearch/Patient-Regis...

Publication types

MeSH terms