. 2011 Dec;7(6):780-8.
doi: 10.1016/j.nano.2011.04.003. Epub 2011 May 4.

Sizing and phenotyping of cellular vesicles using Nanoparticle Tracking Analysis

Affiliations

Sizing and phenotyping of cellular vesicles using Nanoparticle Tracking Analysis

Rebecca A Dragovic et al. Nanomedicine. 2011 Dec.

Abstract

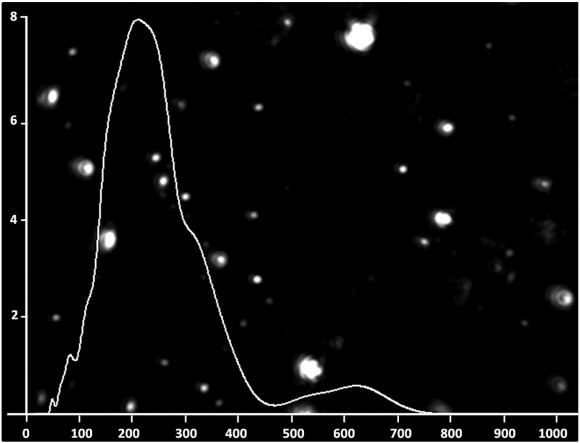
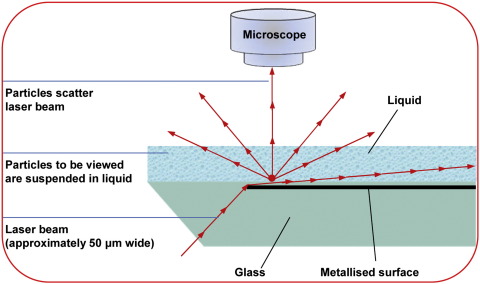
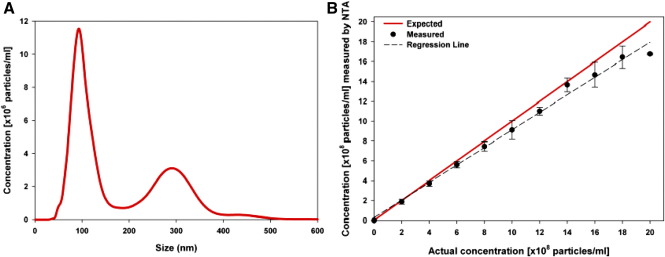
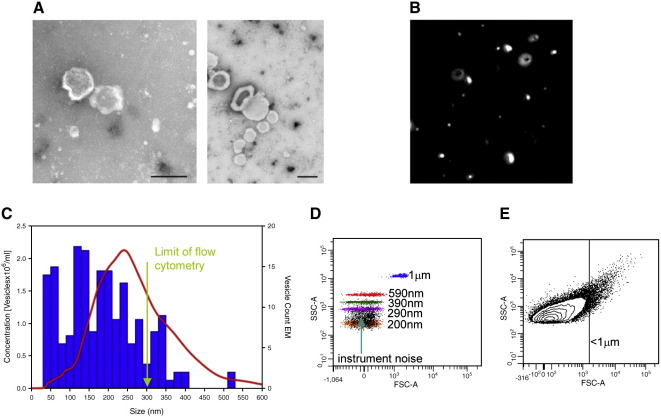
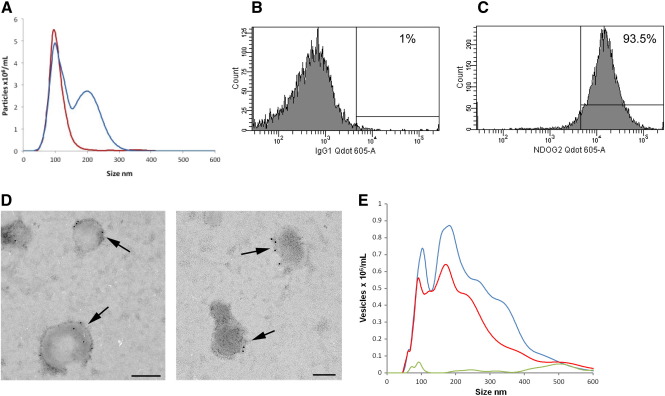
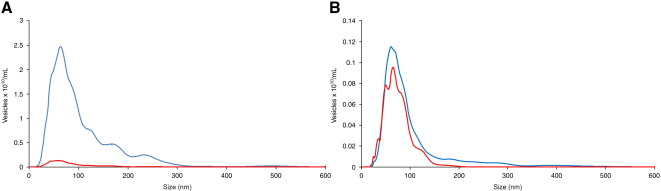
Cellular microvesicles and nanovesicles (exosomes) are involved in many disease processes and have major potential as biomarkers. However, developments in this area are constrained by limitations in the technology available for their measurement. Here we report on the use of fluorescence nanoparticle tracking analysis (NTA) to rapidly size and phenotype cellular vesicles. In this system vesicles are visualized by light scattering using a light microscope. A video is taken, and the NTA software tracks the brownian motion of individual vesicles and calculates their size and total concentration. Using human placental vesicles and plasma, we have demonstrated that NTA can measure cellular vesicles as small as ≈ 50 nm and is far more sensitive than conventional flow cytometry (lower limit ≈ 300 nm). By combining NTA with fluorescence measurement we have demonstrated that vesicles can be labeled with specific antibody-conjugated quantum dots, allowing their phenotype to be determined.

From the clinical editor: The authors of this study utilized fluorescence nanoparticle tracking analysis (NTA) to rapidly size and phenotype cellular vesicles, demonstrating that NTA is far more sensitive than conventional flow cytometry.


Figures

None
Graphical abstract
Figure 1
Figure 1
NanoSight instrument configuration.
Figure 2
Figure 2
NTA measurement of particle size and concentration. (A) Mixture of 100 nm and 300 nm polystyrene beads (ratio 5:1) analyzed by NTA. (B) NTA analysis of 100-nm beads at a range of concentrations from 2 × 10⁸ to 20 × 108 per milliliter, mean ± SD of five replicates. The actual values for the concentration of the beads are shown on the x-axis and those measured by NTA on the y-axis.
Figure 3
Figure 3
Comparison of NTA, electron microscopy (EM), and flow cytometry analysis of placental vesicles. (A) Electron micrograph of placental vesicle ultracentrifuge pellet. Scale bars, 200 nm. (B) Screen shot of video from NanoSight LM10 showing optimal light scatter from placental vesicles. (C) Vesicle size determined by direct measurement from electron micrographs (blue bars) and NTA (red line). (D) Size resolution of marker beads by forward (FSC) and side scatter (SSC) in flow cytometry. Instrument noise was defined by running 100-nm-filtered PBS. (E) Placental vesicle FSC and SSC by flow cytometry.
Figure 4
Figure 4
Fluorescence NTA analysis of placental vesicles. (A) Mixture of fluorescent 100 nm and nonfluorescent 200 nm beads analyzed on the NanoSight NS500 using light scatter from the 405 nm violet laser (blue line) and the same bead mixture analyzed for fluorescence only using a 430 nm filter (red line). (B) Placental vesicles labeled with mouse IgG1 isotype control antibody conjugated to quantum dots and analyzed by flow cytometry. (C) Placental vesicles labeled with antibody NDOG2 specific to placental vesicles conjugated to quantum dots and analyzed by flow cytometry. (D) Immunogold labeling of placental vesicles with NDOG2 antibody. (E) Placental vesicles labeled with antibody NDOG2 conjugated to quantum dots and analyzed on the NanoSight NS500 in light scatter (blue line) and fluorescence (red line) modes. The green line shows placental vesicles labeled with the mouse IgG1 quantum dot isotype control antibody analyzed in fluorescence mode.
Figure 5
Figure 5
Fluorescence analysis of cellular vesicles in plasma. (A) Platelet-free plasma labeled directly with the QTracker cell-labeling reagent coupled to quantum dots and analyzed on the NanoSight NS500 in light scatter (blue line) and fluorescence (red line) modes. (B) Ultracentrifuge pellet of the same plasma sample labeled with QTracker and analyzed on the NanoSight NS500 in light scatter (blue line) and fluorescence (red line) modes.

References

    1. Orozco A.F., Lewis D.E. Flow cytometric analysis of circulating microparticles in plasma. Cytometry Part A. 2010;77:502–514. - PMC - PubMed
    1. Cocucci E., Racchetti G., Meldolesi J. Shedding microvesicles:artefacts no more. Trends Cell Biol. 2009;19:43–51. - PubMed
    1. Chaput N, Thery C. Exosomes: immune properties and potential clinical implementations. Semin Immunopathol. (21 December 2010; Epub ahead of print; doi:10.1007/s00281-010-0233-9). - PubMed
    1. Thery C., Ostrowski M., Segura E. Membrane vesicles as conveyors of immune responses. Nature Rev. 2009;9:581–593. - PubMed
    1. Enjeti A.K., Lincz L.F., Seldon M. Microparticles in health and disease. Semin Thromb Hemost. 2008;34:683–691. - PubMed

Publication types