. 2011 Aug;55(2):307-17.
doi: 10.1016/j.cyto.2011.04.014. Epub 2011 May 23.

T cells expanded in presence of IL-15 exhibit increased antioxidant capacity and innate effector molecules

Affiliations

T cells expanded in presence of IL-15 exhibit increased antioxidant capacity and innate effector molecules

Navtej Kaur et al. Cytokine. 2011 Aug.

Abstract

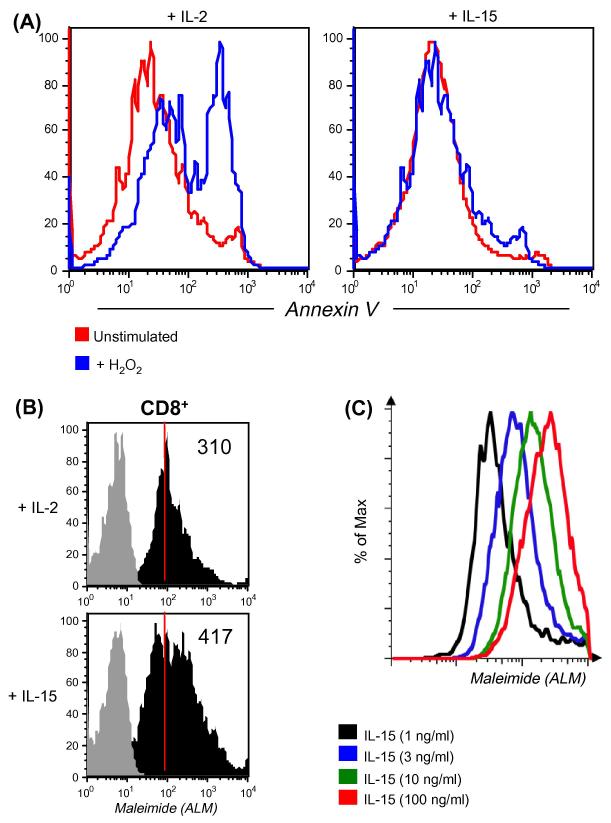
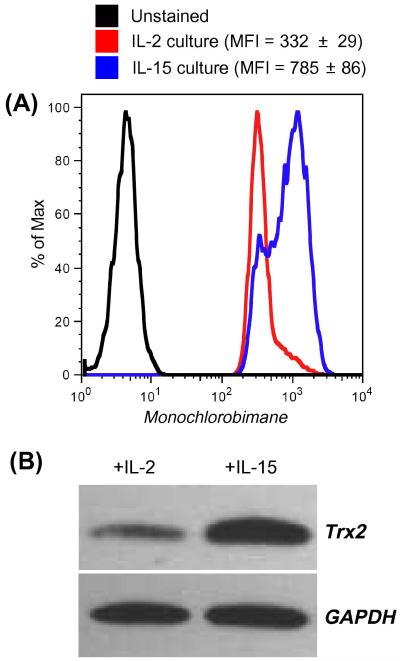
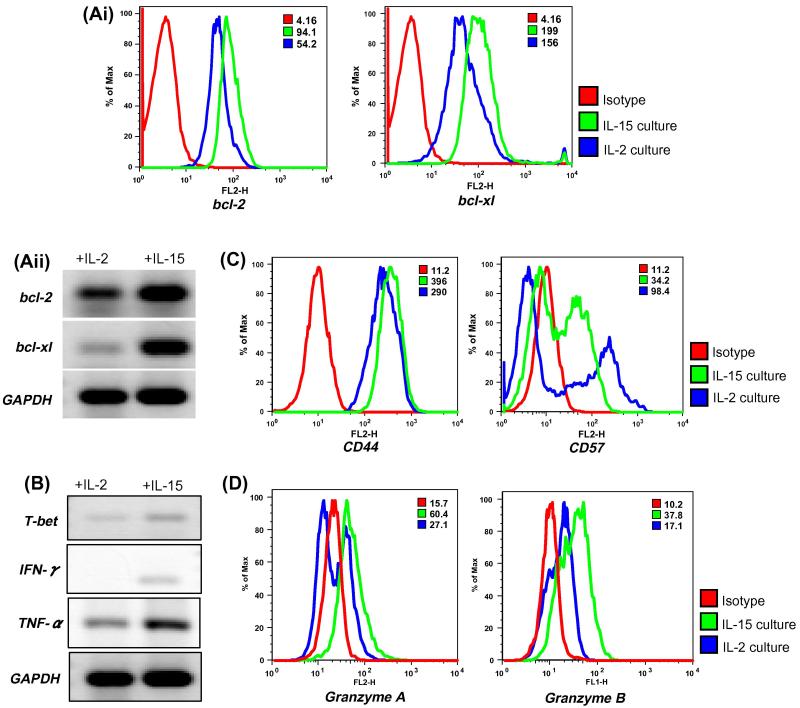
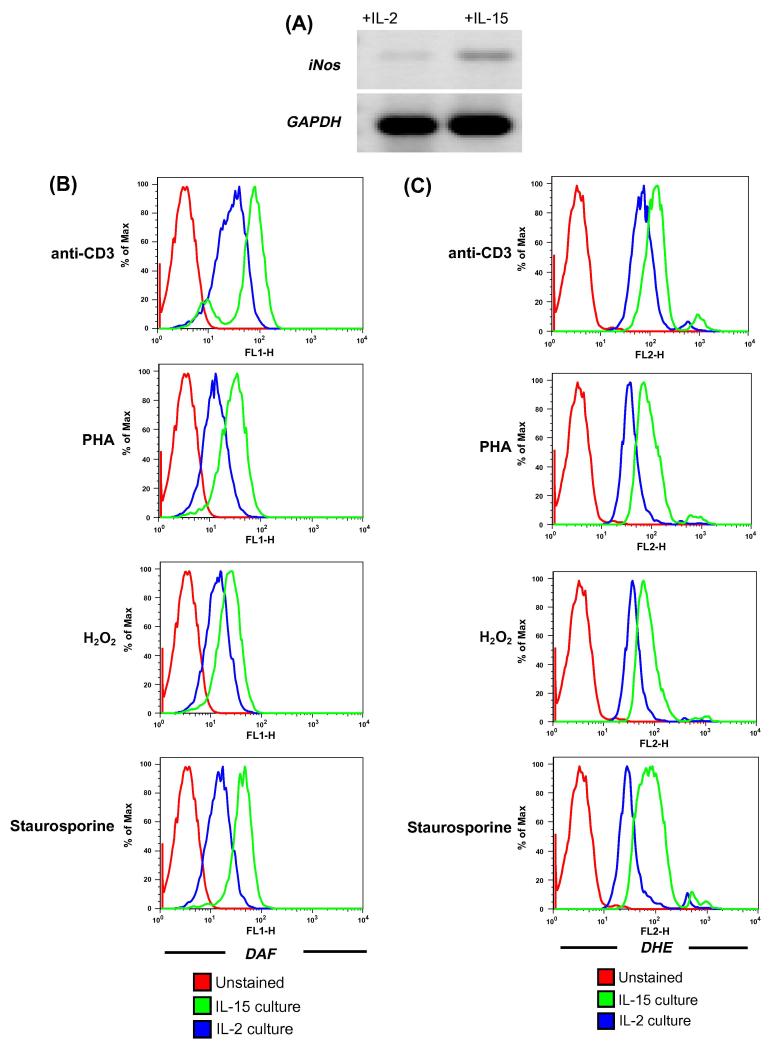
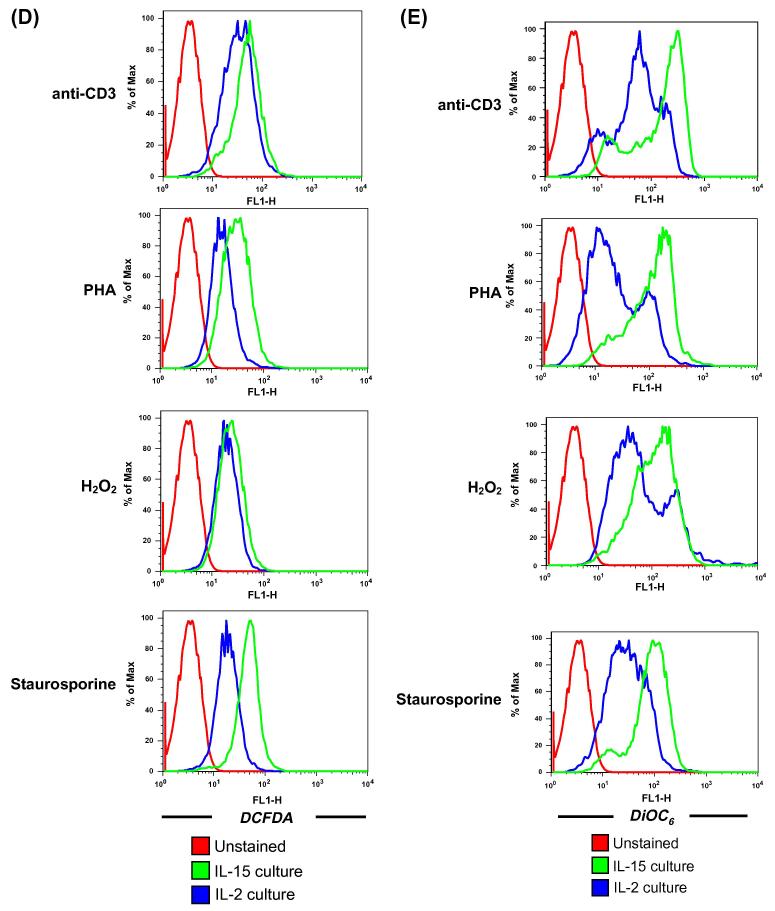
Persistence of effector cytotoxic T lymphocytes (CTLs) during an immunological response is critical for successfully controlling a viral infection or tumor growth. Various cytokines are known to play an important part in regulating the immune response. The IL-2 family of cytokines that includes IL-2 and IL-15 are known to function as growth and survival factors for antigen-experienced T cells. IL-2 and IL-15 possess similar properties, including the ability to induce T cell proliferation. Whereas long-term IL-2 exposure has been shown to promote apoptosis and limit CD8(+) memory T cell survival and proliferation, it is widely believed that IL-15 can inhibit apoptosis and helps maintain a memory CD8(+) T-cell population. However, mechanisms for superior outcomes for IL-15 as compared to IL-2 are still under investigation. Our data shows that human T cells cultured in the presence of IL-15 exhibit increased expression of anti-oxidant molecules glutathione reductase (GSR), thioredoxin reductase 1 (TXNDR1), peroxiredoxin (PRDX) and superoxide dismutase (SOD). An increased expression of cell-surface thiols, intracellular glutathione, and thioredoxins was also noted in IL-15 cultured T cells. Additionally, IL-15 cultured T cells showed an increase in cytolytic effector molecules. Apart from increased level of Granzyme A and Granzyme B, IL-15 cultured T cells exhibited increased accumulation of reactive oxygen (ROS) and reactive nitrogen species (RNS) as compared to IL-2 cultured T cells. Overall, this study suggests that T cells cultured in IL-15 show increased persistence not only due to levels of anti-apoptotic proteins, but also due to increased anti-oxidant levels, which is complimented by increased cytolytic effector functions.


Figures

Figure 1
Figure 1. Effect of IL-15 on T cells
(A). CD8+ T cells cultured in the presence of IL-2 and IL-15 for 7 days were exposed to 25 μM of H2O2. Cells were stained for CD8 and Annexin V. Histogram represents level of Annexin V on cells with or without H2O2 stimulation after 16 h. (B). CD8+ T cells cultured in the presence of IL-2 and IL-15 for 7 days were evaluated for expression of cell surface thiols using fluorochrome conjugated maleimide (ALM). Grey histogram represents unstained, whereas black histogram represents fluorescence from stained samples. Numerical values on right corner represent Mean Fluorescence Intensity (MFI). (C). Level of surface thiols on the T cells cultured for 7 days in presence of increasing dose of IL-15 was evaluated using fluorochrome conjugated maleimide (ALM). Each histogram represents fluorescence on cells obtained after co-culture. Data shown in A, B and C are from one of three experiments with similar results.
Figure 2
Figure 2. Expression of intracellular glutathione and thioredoixn-2 in IL-2 and IL-15 cultured T cells
(A). CD8+ T cells cultured in the presence of IL-2 and IL-15 for seven days were tested for expression of intracellular glutathione using monochlorobimane. Histogram represents fluorescence from stained samples. (B). Cell lysates were prepared using CD8+ T cells cultured in the presence of IL-2 and IL-15 for 7 days and probed for the expression of thioredoxin-2. Blots were probed with GAPDH for loading control. Data shown in A and B are from one of three experiments with similar results.
Figure 3
Figure 3. Comparison of IL-15 and IL-2 treatment on expression of anti-apoptotic proteins and cytokine secretion
(Ai). IL-15 and IL-2 cultured CD8+ T cells were used to determine the expression level of anti-apoptotic proteins bcl-2 and bcl-xl. Histograms represent fluorescence intensity of proteins after intracellular staining. Red histogram represents isotype, whereas blue and green histogram represents fluorescence from stained samples. Numerical values on right corner represent Mean Fluorescence Intensity (MFI). (Aii). T cells cultured in the presence of IL-2 and IL-15 for 7 days were used to extract total RNA and RT PCR was performed as described in Material and Methods. Expression of bcl-2, bcl-xl, and GAPDH was assessed. (B). T cells were expanded in the presence of IL-2 or IL-15 for 7 days. Total RNA was isolated and mRNA expression levels of T-bet, IFN-γ and TNF-α were evaluated by RT-PCR. (C). Cell surface marker expression on CD8+ T cells gated population obtained from culture maintained in IL-2 or IL-15 was determined by using fluorochrome conjugated antibodies for CD44and CD57. Histogram represents fluorescence from stained samples. Numerical values on right corner represent Mean Fluorescence Intensity (MFI). (D). CD8+ T cells expanded in either in IL-2 or IL-15 was evaluated for the expression of Granzyme A and Granzyme B. Histogram represents fluorescence from stained samples. Data shown in A - D are from one of three experiments with similar results.
Figure 4
Figure 4. Comparison of IL-15 vs. IL-2 on free radical accumulation and mitochondrial membrane potential
(A). T cells cultured and maintained in the presence of IL-15 or IL-2 for 7 days were evaluated for iNOS expression by RT-PCR. (B-E). CD8+ T cells expanded and maintained in IL-2 and IL-15 were restimulated with anti-CD3 (5μg/ml), PHA (1 μg/ml), H2O2 (100 μM) for overnight and Staurosporin for 2 hours and followed by staining with: (B) DAF to track NO; (C) DHE to track superoxide; (D) DCFDA to track hydrogen peroxide; and (E) DiOC6 to track mitochondrial membrane potential. Histograms represent fluorescence intensity of DAF, DHE, DCFDA and DiOC6 on the CD8+ T cells. Data shown in Figure A - D are from one of three experiments with similar results.

References

    1. Rosenberg SA, Restifo NP, Yang JC, Morgan RA, Dudley ME. Adoptive cell transfer: a clinical path to effective cancer immunotherapy. Nat Rev Cancer. 2008;8:299–308. - PMC - PubMed
    1. Hinrichs CS, Gattinoni L, Restifo NP. Programming CD8+ T cells for effective immunotherapy. Curr Opin Immunol. 2006;18:363–370. - PMC - PubMed
    1. Paulos CM, Kaiser A, Wrzesinski C, Hinrichs CS, Cassard L, Boni A, et al. Toll-like receptors in tumor immunotherapy. Clin Cancer Res. 2007;13:5280–5289. - PMC - PubMed
    1. Gattinoni L, Powell DJ, Jr., Rosenberg SA, Restifo NP. Adoptive immunotherapy for cancer: building on success. Nat Rev Immunol. 2006;6:383–393. - PMC - PubMed
    1. Gattinoni L, Klebanoff CA, Restifo NP. Pharmacologic induction of CD8+ T cell memory: better living through chemistry. Sci Transl Med. 2009;1:11ps12. - PMC - PubMed

Publication types