. 2011 Jul 8;286(27):24007-14.
doi: 10.1074/jbc.M111.223289. Epub 2011 May 20.

Interplay between flavodiiron proteins and photorespiration in Synechocystis sp. PCC 6803

Affiliations

Interplay between flavodiiron proteins and photorespiration in Synechocystis sp. PCC 6803

Yagut Allahverdiyeva et al. J Biol Chem. .

Abstract

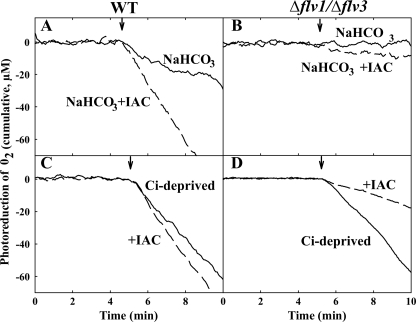
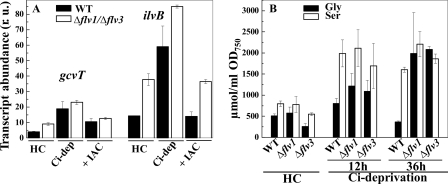
Flavodiiron (Flv) proteins are involved in detoxification of O(2) and NO in anaerobic bacteria and archaea. Cyanobacterial Flv proteins, on the contrary, function in oxygenic environment and possess an extra NAD(P)H:flavin oxidoreductase module. Synechocystis sp. PCC 6803 has four genes (sll1521, sll0219, sll0550, and sll0217) encoding Flv proteins (Flv1, Flv2, Flv3, and Flv4). Previous in vitro studies with recombinant Flv3 protein from Synechocystis provided evidence that it functions as a NAD(P)H:oxygen oxidoreductase, and subsequent in vivo studies with Synechocystis confirmed the role of Flv1 and Flv3 proteins in the Mehler reaction (photoreduction of O(2) to H(2)O). Interestingly, homologous proteins to Flv1 and Flv3 can be found also in green algae, mosses, and Selaginella. Here, we addressed the function of Flv1 and Flv3 in Synechocystis using the Δflv1, Δflv3, and Δflv1/Δflv3 mutants and applying inorganic carbon (C(i))-deprivation conditions. We propose that only the Flv1/Flv3 heterodimer form is functional in the Mehler reaction in vivo. (18)O(2) labeling was used to discriminate between O(2) evolution in photosynthetic water splitting and O(2) consumption. In wild type, ∼20% of electrons originated from water was targeted to O(2) under air level CO(2) conditions but increased up to 60% in severe limitation of C(i). Gas exchange experiments with Δflv1, Δflv3, and Δflv1/Δflv3 mutants demonstrated that a considerable amount of electrons in these mutants is directed to photorespiration under C(i) deprivation. This assumption is in line with increased transcript abundance of photorespiratory genes and accumulation of photorespiratory intermediates in the WT and to a higher extent in mutant cells under C(i) deprivation.


Figures

FIGURE 1.
FIGURE 1.
Light response of the acceptor side limitation of PSI, Y(NA). The acceptor side limitation of PSI was recorded from the WT (■) and Δflv1 (●) mutant strain. 0.1 mm methyl viologen (○) was added to Δflv1 cell suspension before the measurement. Values are the mean ± S.D. from three independent experiments.
FIGURE 2.
FIGURE 2.
Mass spectrometric measurements of CO2 uptake during dark-light transition. During measurement, the cells were first kept in darkness for 5 min, and thereafter the white light of 500 μmol photons m−2 s−1 was turned on (upward arrow) and off again (downward arrow).
FIGURE 3.
FIGURE 3.
Mass spectrometric measurements of O2 consumption during dark-light transition in the WT, Δflv1, Δflv3, and Δflv1/Δflv3 mutants of Synechocystis. The cells were kept in darkness for 5 min and then illuminated with white light of 500 μmol photons m−2 s−1 for 5 min to measure the uptake of O2. The asterisk represents cells demonstrated only trace amount of 18O2 consumption. White bars, 5 mm NaHCO3 was present in the medium. Black bars, measurements were performed with the cells exposed to Ci deprivation. Values are the mean ± S.D. from three independent experiments.
FIGURE 4.
FIGURE 4.
Effect of KCN on dark respiration and photoreduction of O2. Dark respiration (A) and O2 photoreduction (B) were monitored after addition of KCN (final concentration, 1 mm) (dashed line in B) to Ci-deprived Δflv1flv3 cells. Arrays indicate the addition of inhibitor (A) and switching on the actinic light (B). In B, the cumulative O2 uptake curve is calculated from 18O2/16O2 exchange measurements and is presented here after subtraction of the dark O2 uptake rate for better legibility.
FIGURE 5.
FIGURE 5.
Effect of IAC on photoreduction of O2 in the WT and Δflv1flv3 cells. O2 photoreduction was monitored in the presence of 5 mm NaHCO3 (solid line) and in the presence of both 5 mm NaHCO3 and 8 mm IAC (dashed line) from the WT (A) and Δflv1/Δflv3 mutant cells (B). Similar measurements were performed from the WT (C) and Δflv1/Δflv3 (D) cells after Ci deprivation. Arrays indicate switching on the light. Cumulative O2 uptake curve was calculated from 18O2/16O2 exchange measurements and is presented here after subtraction of dark O2 uptake rate for better legibility.
FIGURE 6.
FIGURE 6.
Effect of Ci deprivation on photorespiratory markers. A, transcript abundance of the gcvT and ilvB genes in the WT (black bars) and Δflv1flv3 (white bars) cells. Samples were taken from the cells grown in the presence of 3% CO2 (HC), after 12 h shift from HC to Ci deprivation conditions (Ci -dep) and after 4 h treatment with IAC of the samples incubated at Ci deprivation for 8 h (+IAC). r.u., relative units. B, accumulation of Gly and Ser in the WT, Δflv1, and Δflv3 cells. Samples were taken from the cells grown in the presence of 3% CO2, after a 12- and 36-h shift from HC to Ci deprivation conditions.
FIGURE 7.
FIGURE 7.
Dimerization of the Flv1 and Flv3 proteins in the WT and mutant cells. Soluble fraction of cellular proteins was isolated as described (6). Protein complexes were separated using 6–13% gradient blue native PAGE electrophoresis (A) and immunodetected with Flv3 antibody (B). The arrow indicates the location of the Flv3 protein where it is present as a dimer with molecular mass of ∼140 kDa. The molecular mass of the Flv monomer is 70 kDa. Gels were loaded on a protein basis.

Similar articles

Cited by

References

    1. Vicente J. B., Justino M. C., Gonçalves V. L., Saraiva L. M., Teixeira M. (2008) Methods Enzymol. 437, 21–45 - PubMed
    1. Vicente J. B., Testa F., Mastronicola D., Forte E., Sarti P., Teixeira M., Giuffrè A. (2009) Arch. Biochem. Biophys. 488, 9–13 - PubMed
    1. Di Matteo A., Scandurra F. M., Testa F., Forte E., Sarti P., Brunori M., Giuffrè A. (2008) J. Biol. Chem. 283, 4061–4068 - PubMed
    1. Frazão C., Silva G., Gomes C. M., Matias P., Coelho R., Sieker L., Macedo S., Liu M. Y., Oliveira S., Teixeira M., Xavier A. V., Rodrigues-Pousada C., Carrondo M. A., Le Gall J. (2000) Nat. Struct. Biol. 7, 1041–1045 - PubMed
    1. Vicente J. B., Gomes C. M., Wasserfallen A., Teixeira M. (2002) Biochem. Biophys. Res. Commun. 294, 82–87 - PubMed

Publication types

MeSH terms

LinkOut - more resources