Comparative Study
. 2011 Jul 1;174(1):109-17.
doi: 10.1093/aje/kwr037. Epub 2011 May 20.

Age-specific differences in influenza A epidemic curves: do children drive the spread of influenza epidemics?

Affiliations
Comparative Study

Age-specific differences in influenza A epidemic curves: do children drive the spread of influenza epidemics?

Dena Schanzer et al. Am J Epidemiol. .

Abstract

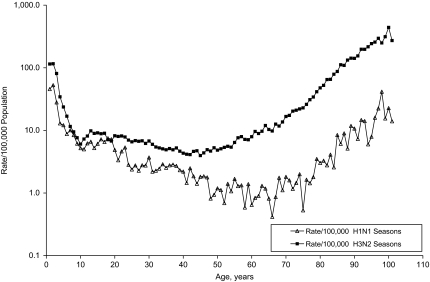
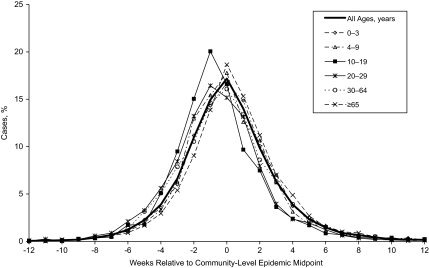
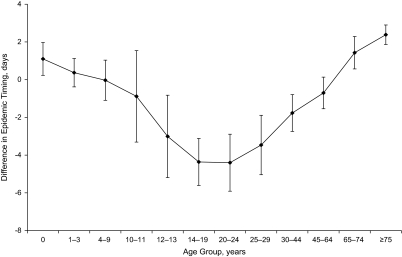
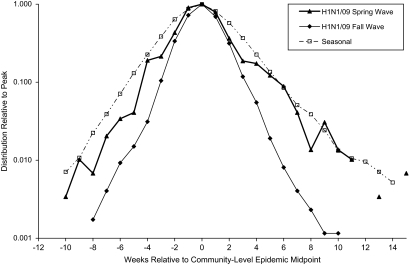
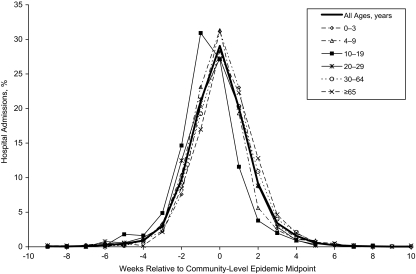
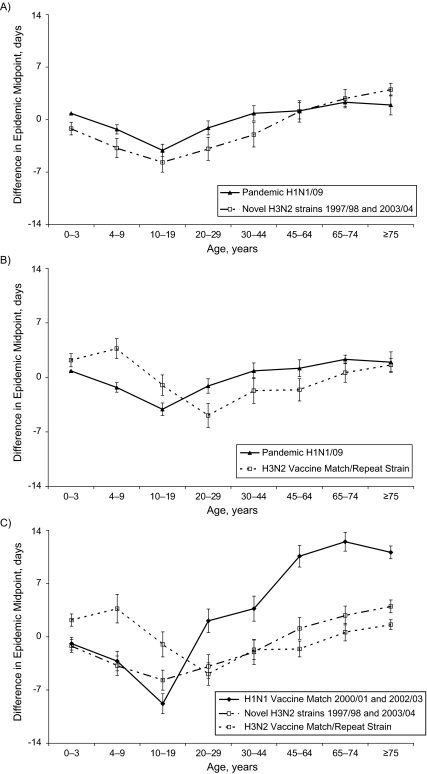
There is accumulating evidence suggesting that children may drive the spread of influenza epidemics. The objective of this study was to quantify the lead time by age using laboratory-confirmed cases of influenza A for the 1995/1996-2005/2006 seasons from Canadian communities and laboratory-confirmed hospital admissions for the H1N1/2009 pandemic strain. With alignment of the epidemic curves locally before aggregation of cases, slight age-specific differences in the timing of infection became apparent. For seasonal influenza, both the 10-19- and 20-29-year age groups peaked 1 week earlier than other age groups, while during the fall wave of the 2009 pandemic, infections peaked earlier among only the 10-19-year age group. In the H3N2 seasons, infections occurred an average of 3.9 (95% confidence interval: 1.7, 6.1) days earlier in the 20-29-year age group than for youth aged 10-19 years, while during the fall pandemic wave, the 10-19-year age group had a statistically significant lead of 3 days compared with both younger children aged 4-9 years and adults aged 20-29 years (P < 0.0001). This analysis casts doubt on the hypothesis that younger school-age children actually lead influenza epidemic waves.


Figures

Figure 1.
Figure 1.
Laboratory-confirmed cases of influenza A/100,000 population per season, 1996/1997–2005/2006, by subtype, Canada. The age-specific rate of laboratory confirmation of influenza A virus differs by subtype.
Figure 2.
Figure 2.
Distribution of laboratory-confirmed influenza A cases by age and week relative to the community-level epidemic midpoint, Canada, 1996/1997–2005/2006. Age-specific composite epidemic curves were created by centering the local epidemics relative to their epidemic midpoint of the geographic unit and aggregating cases for geographic units with at least 25 cases per season and seasons where a single influenza A strain predominated.
Figure 3.
Figure 3.
Differences in the timing of influenza A epidemic waves by age group among laboratory-confirmed cases, Canada, 1996/1997–2003/2004. After alignment of the epidemic locally, age-specific composite epidemic curves were created by aggregating cases by the day relative to the local midpoint and age group. The mean differences in relative timing and the standard error of the mean were calculated for each age group. Error bars correspond to 95% confidence intervals.
Figure 4.
Figure 4.
Distribution of laboratory-confirmed influenza A cases/admissions, by week relative to the local epidemic midpoint, Canada, 2009. Composite epidemic curves are shown for both waves of the H1N1/09 pandemic strain in Canada and for seasonal influenza epidemic waves. As the composite epidemic curves for the spring and fall waves suggest that transmission/epidemic growth was slower during the spring wave, data from the 2 pandemic waves were analyzed separately.
Figure 5.
Figure 5.
Distribution of laboratory-confirmed pandemic influenza hospital admissions, by age and week relative to the community-level epidemic midpoint, H1N1/09/fall wave, Canada, 2009. The 10–19-year age group leads the H1N1/09 fall pandemic wave.
Figure 6.
Figure 6.
Age-group differences in the timing of influenza A waves, Canada, 1997–1998 and 2003–2004 seasons. A, the age structure of the fall wave of the H1N1/09 pandemic compared with H3N2 seasons where the predominant strain emerged quickly and the vaccine was not a good antigenic match to the predominant circulating strain. The relative timing of infections was not statistically different for the 6 younger age groups (covering the ages of 0–64 years). The gap between the 2 curves is accounted for by a shift of approximately 2 days in the overall epidemic midpoint resulting from a shift in disease burden toward younger age groups during the pandemic. B, the age structure for the fall wave of the H1N1/09 pandemic compared with seasonal H3N2 waves for seasons where the antigenic strain circulated in the previous season and the vaccine was considered a good antigenic match to the predominant circulating strain. C, the age structure for seasonal influenza by subtype and vaccine match.

References

    1. Olson DR, Heffernan RT, Paladini M, et al. Monitoring the impact of influenza by age: emergency department fever and respiratory complaint surveillance in New York City [electronic article] PLoS Med. 2007;4(8):e247. - PMC - PubMed
    1. Longini IM, Jr, Koopman JS, Haber M, et al. Statistical inference for infectious diseases. Risk-specific household and community transmission parameters. Am J Epidemiol. 1988;128(4):845–859. - PubMed
    1. Glass LM, Glass RJ. Social contact networks for the spread of pandemic influenza in children and teenagers [electronic article] BMC Public Health. 2008;8:61. - PMC - PubMed
    1. Mossong J, Hens N, Jit M, et al. Social contacts and mixing patterns relevant to the spread of infectious diseases [electronic article] PLoS Med. 2008;5(3):e74. - PMC - PubMed
    1. Wallinga J, Teunis P, Kretzschmar M. Using data on social contacts to estimate age-specific transmission parameters for respiratory-spread infectious agents. Am J Epidemiol. 2006;164(10):936–944. - PubMed

Publication types

MeSH terms