. 2011 Jun 7;108(23):9715-20.
doi: 10.1073/pnas.1105713108. Epub 2011 May 20.

Expanded methyl-sensitive cut counting reveals hypomethylation as an epigenetic state that highlights functional sequences of the genome

Affiliations

Expanded methyl-sensitive cut counting reveals hypomethylation as an epigenetic state that highlights functional sequences of the genome

Alejandro Colaneri et al. Proc Natl Acad Sci U S A. .

Erratum in

  • Proc Natl Acad Sci U S A. 2013 Mar 19;110(12):4853

Abstract

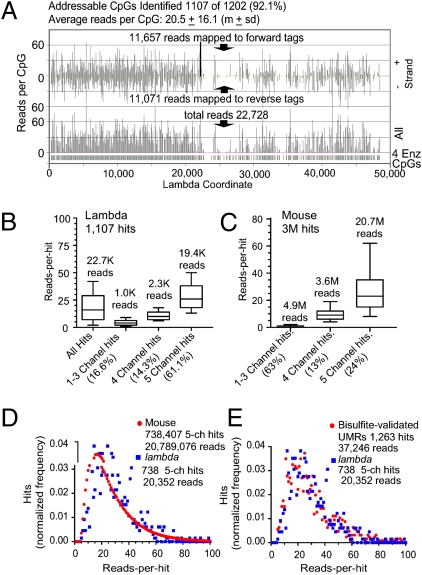
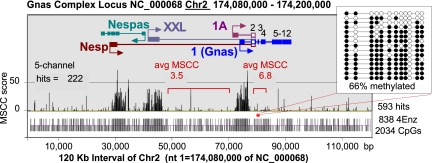
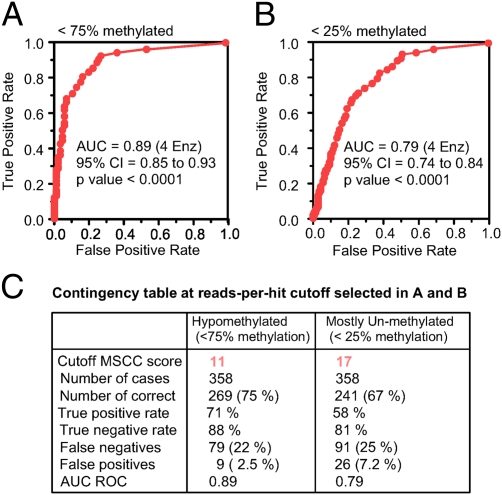
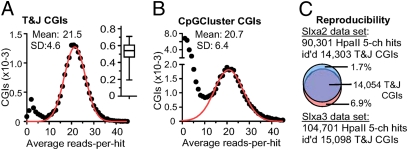
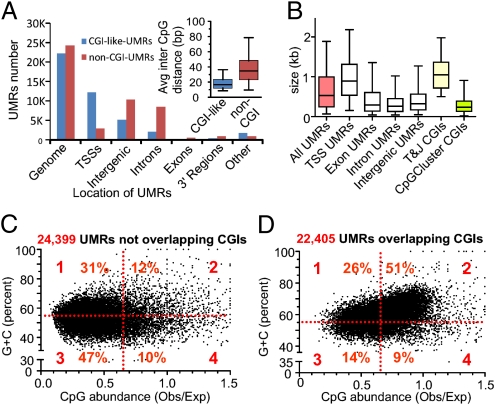
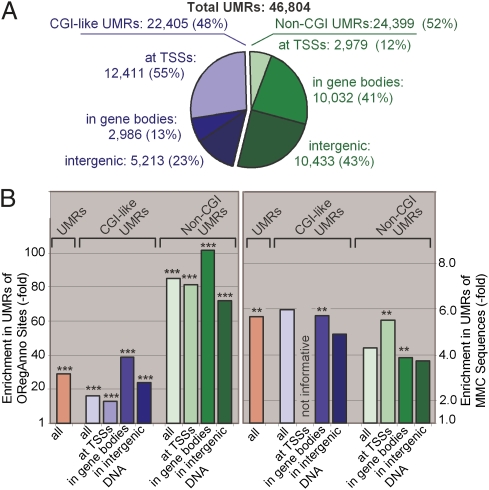
Methyl-sensitive cut counting (MSCC) with the HpaII methylation-sensitive restriction enzyme is a cost-effective method to pinpoint unmethylated CpGs at single base-pair resolution. However, it has the drawback of addressing only CpGs in the context of the CCGG site, leaving out the remainder of the possible 16 XCGX tetranucleotides in which CpGs are found. We expanded MSCC to include three additional enzymes to address a total of 5 of the 16 XCGX combinations. This allowed us to survey methylation at about one-third of all a mammalian genome's CpGs. Applied to mouse liver DNA, we correctly confirmed data reported with other methods showing hypomethylation to be concentrated at promoters and in CpG islands (CGIs), with gene bodies and intergenic regions being mostly methylated. Grouping unmethylated CpGs, characterized by high MSCC scores (7% false discovery rate), we found a large number of unmethylated regions not qualifying as CGIs located in intergenic and intronic regions, which are highly enriched in functional DNA sequences (open regulatory annotation database) as well as in noncoding yet highly conserved mammalian sequences thought to be important but with as yet unknown function. About 50% of MSCC-defined unmethylated regions do not overlap algorithm-defined CGIs and offer a novel search space in which new functionalities of DNA may be found in health and disease.


Conflict of interest statement

The authors declare no conflict of interest.

Figures

Fig. 1.
Fig. 1.
Analysis of reads that mapped to lambda DNA: comparison with mouse. (A) Plots of reads per hit (identified CpGs) along the lambda genome. (Upper) Reads-per-hit plot of identified forward and reverse tags. (Lower) Combined forward and reverse reads per hit. (B) Box-and-whisker plots (median, quartiles, and fifth and 95th percentiles) representing the reads-per-hit distribution as a function of the number of channels in which the CpG-identifying reads were found in the lambda genome. (C) Same as in B but for CpGs detected in the mouse genome. (D and E) Frequency histograms of the reads per hit recovered for CpGs identified with 4Enz in the five sequencing channels. ch, channel. (D) Distribution of read recovery from the lambda genome is compared with that of reads recovered from the whole-mouse genome. (E) Distribution of read recovery from the lambda genome is compared with that of the reads per hit found in CpGs that were located in UMRs of the mouse genome validated by bisulfite sequencing analysis.
Fig. 2.
Fig. 2.
Single CpG resolution profile of hypomethylation on a genome-wide scale. The MSCC data from the genomic region spanning the Gnas complex locus are shown. The promoters for Nesp, Nespas, Gnasxl, and Exon1A lie within differentially methylated regions (DMRs) that have been identified in the locus. Exon 1 of Gnas is located in a biallelic UMR contiguous to the DMR containing exon 1A. Tick bars at the bottom of the figure indicate the positions of CpGs and 4Enz CpGs. The majority of the sites are largely resistant to 4Enz, except for those located in three regions colocalizing with the described promoters. Low avgMSCC scores for two regions outside the three major UMRs indicate that these regions are heavily methylated (Fig. 3). (Inset) Bisulfite sequencing analysis confirms this conclusion.
Fig. 3.
Fig. 3.
ROC analysis generated from MSCC scores and bisulfite sequencing data. (A) MSCC scores are used to classify CpGs as hypomethylated (<75% methylation) or heavily methylated (>75% methylation). (B) Same as in A but classifying CpGs as mostly unmethylated (<25% methylation) or not. (C) Summary of the results when an MSCC score of 11 or 17 is selected as the optimal cutoff for the classification process. The true-positive rate indicates CpGs with a methylation rate <75% (25%) and an MSCC score >11 (or 17)/CpGs with a methylation rate <75% (or <25%). The true-negative rate indicates CpGs with a methylation rate >75% (or 25%) and an MSCC score <11 (or 17)/total CpGs with a methylation rate >75% (or 25%). The false-negative rate indicates CpGs with a methylation rate <75% (or 25%) and an MSCC score <11 (or 17). The false-positive rate indicates CpGs with a methylation rate >75% (or 25%) and an MSCC score >11 (or 17).
Fig. 4.
Fig. 4.
Analysis of methylation at CGIs. (A) T&J CGIs, wherein addressable CpGs represent one-third of the total CpGs, were selected for this analysis. At each CGI, the average reads-per-hit ratio was calculated, and the distribution of these ratios is represented as a frequency histogram (black dots). The red curve is the result of fitting a Gaussian model to the data. Means and SDs were calculated from this model. (Inset) Distribution of the fractional addressability of CpGs among T&J CGIs. The box-and-whisker plot depicts the median, first and third quartiles, and fifth and 95th percentiles. (B) Same as in A but analyzing CGIs predicted by CpGCluster. (C) Reproducibility in the identification of unmethylated T&J CGIs with HpaII hits in two experiments (SI Appendix, Table S4). The 5-ch HpaII hits of the Slxa2 experiment collected 4,396,101 reads; those of the Slxa3 experiment collected 5,904,634 reads. 5-ch, five-channel.
Fig. 5.
Fig. 5.
CGI-like and non-CGI UMRs as detected genome-wide in the mouse liver genome. (A) Distribution of UMRs in the major genomic compartments: TSS regions (−3 Kb to +2 Kb of the TSS) and 3′ region of genes (3 Kb). For this segmentation, the RefSeq definition of genes was used. If a UMR is not completely included in one of the five categories, it was labeled as “other.” UMRs were classified as overlapping or not in the combined set of CGIs (T&J, GG&F, or CpGCluster). (Inset) Distributions of the average inter-CpG distance calculated for each UMR, represented as box-and-whisker plots depicting the median, quartiles, and fifth and 95th percentiles. (B) Size distribution of UMRs and comparison with CGIs. Box-and-whisker plots (median, quartiles, and fifth and 95th percentiles) represent the distribution of sizes for UMRs that were completely included in the indicated genomic regions. (C and D) Scatter plots represent the (C + G) content vs. Obs/Exp CpG ratio in UMRs that overlap and do not overlap CGIs. Note the large proportion of UMRs that do not meet CGI criteria. Obs/Exp, observed/expected.
Fig. 6.
Fig. 6.
Genomic distribution of UMRs and enrichment of annotated features. (A) Distribution of CGI-like and non-CGI UMRs in genomic regions. UMRs at TSS regions (−3 kb to +2 kb of TSS), in gene bodies (non-TSS exons, introns, and +3 kb of 3′ not-transcribed regions), and in intergenic DNA do not add up to 100 because only those UMRs with >90% overlap were considered. (B) Enrichment of ORegAnno sites and MMC sequences in the UMRs located in the indicated genomic regions. Enrichments are compared with abundance in the undiluted genome (numerical values are provided in SI Appendix, Table S12). **P < 0.005; ***P < 0.0001.

References

    1. Suzuki MM, Bird A. DNA methylation landscapes: Provocative insights from epigenomics. Nat Rev Genet. 2008;9:465–476. - PubMed
    1. Leonhardt H, Bestor TH. Structure, function and regulation of mammalian DNA methyltransferase. EXS. 1993;64:109–119. - PubMed
    1. Antequera F, Bird A. Number of CpG islands and genes in human and mouse. Proc Natl Acad Sci USA. 1993;90:11995–11999. - PMC - PubMed
    1. Bird AP. CpG-rich islands and the function of DNA methylation. Nature. 1986;321:209–213. - PubMed
    1. Irizarry RA, Wu H, Feinberg AP. A species-generalized probabilistic model-based definition of CpG islands. Mamm Genome. 2009;20:674–680. - PMC - PubMed

Publication types