

GProX, a user-friendly platform for bioinformatics analysis and visualization of quantitative proteomics data
- PMID: 21602510
- PMCID: PMC3149098
- DOI: 10.1074/mcp.O110.007450
GProX, a user-friendly platform for bioinformatics analysis and visualization of quantitative proteomics data
Abstract
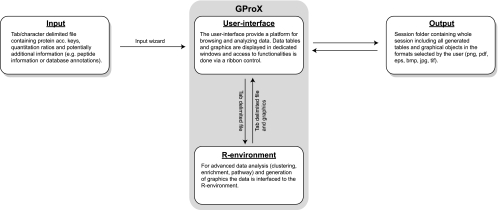
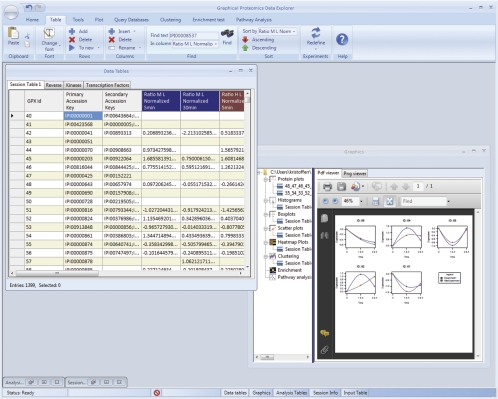
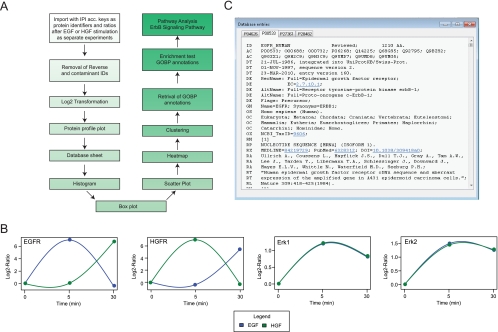
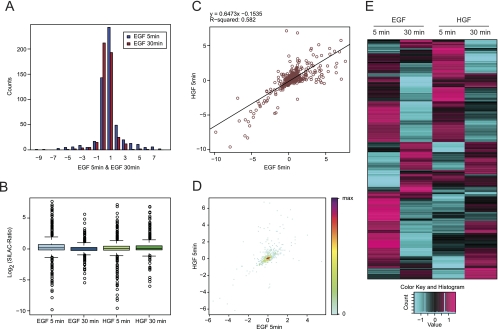
Recent technological advances have made it possible to identify and quantify thousands of proteins in a single proteomics experiment. As a result of these developments, the analysis of data has become the bottleneck of proteomics experiment. To provide the proteomics community with a user-friendly platform for comprehensive analysis, inspection and visualization of quantitative proteomics data we developed the Graphical Proteomics Data Explorer (GProX)(1). The program requires no special bioinformatics training, as all functions of GProX are accessible within its graphical user-friendly interface which will be intuitive to most users. Basic features facilitate the uncomplicated management and organization of large data sets and complex experimental setups as well as the inspection and graphical plotting of quantitative data. These are complemented by readily available high-level analysis options such as database querying, clustering based on abundance ratios, feature enrichment tests for e.g. GO terms and pathway analysis tools. A number of plotting options for visualization of quantitative proteomics data is available and most analysis functions in GProX create customizable high quality graphical displays in both vector and bitmap formats. The generic import requirements allow data originating from essentially all mass spectrometry platforms, quantitation strategies and software to be analyzed in the program. GProX represents a powerful approach to proteomics data analysis providing proteomics experimenters with a toolbox for bioinformatics analysis of quantitative proteomics data. The program is released as open-source and can be freely downloaded from the project webpage at http://gprox.sourceforge.net.
Figures


Similar articles
-
ProteoSign: an end-user online differential proteomics statistical analysis platform.Nucleic Acids Res. 2017 Jul 3;45(W1):W300-W306. doi: 10.1093/nar/gkx444. Nucleic Acids Res. 2017. PMID: 28520987 Free PMC article.
-
Software tool for researching annotations of proteins: open-source protein annotation software with data visualization.Anal Chem. 2009 Dec 1;81(23):9819-23. doi: 10.1021/ac901335x. Anal Chem. 2009. PMID: 19839595 Free PMC article.
-
Analysis and Visualization of Quantitative Proteomics Data Using FragPipe-Analyst.J Proteome Res. 2024 Oct 4;23(10):4303-4315. doi: 10.1021/acs.jproteome.4c00294. Epub 2024 Sep 10. J Proteome Res. 2024. PMID: 39254081
-
A tutorial for software development in quantitative proteomics using PSI standard formats.Biochim Biophys Acta. 2014 Jan;1844(1 Pt A):88-97. doi: 10.1016/j.bbapap.2013.04.004. Epub 2013 Apr 12. Biochim Biophys Acta. 2014. PMID: 23584085 Free PMC article. Review.
-
Visualization of proteomics data using R and bioconductor.Proteomics. 2015 Apr;15(8):1375-89. doi: 10.1002/pmic.201400392. Proteomics. 2015. PMID: 25690415 Free PMC article. Review.
Cited by
-
Fast and easy phosphopeptide fractionation by combinatorial ERLIC-SCX solid-phase extraction for in-depth phosphoproteome analysis.Nat Protoc. 2016 Jan;11(1):37-45. doi: 10.1038/nprot.2015.134. Epub 2015 Dec 3. Nat Protoc. 2016. PMID: 26633130
-
Identification of autophagosome-associated proteins and regulators by quantitative proteomic analysis and genetic screens.Mol Cell Proteomics. 2012 Mar;11(3):M111.014035. doi: 10.1074/mcp.M111.014035. Epub 2012 Feb 6. Mol Cell Proteomics. 2012. PMID: 22311637 Free PMC article.
-
Macrophage Phosphoproteome Analysis Reveals MINCLE-dependent and -independent Mycobacterial Cord Factor Signaling.Mol Cell Proteomics. 2019 Apr;18(4):669-685. doi: 10.1074/mcp.RA118.000929. Epub 2019 Jan 11. Mol Cell Proteomics. 2019. PMID: 30635358 Free PMC article.
-
OmicsOne: associate omics data with phenotypes in one-click.Clin Proteomics. 2021 Dec 11;18(1):29. doi: 10.1186/s12014-021-09334-w. Clin Proteomics. 2021. PMID: 34895137 Free PMC article.
-
Protein synthesis rate is the predominant regulator of protein expression during differentiation.Mol Syst Biol. 2013;9:689. doi: 10.1038/msb.2013.47. Mol Syst Biol. 2013. PMID: 24045637 Free PMC article.
References
-
- Rigbolt K. T., Prokhorova T. A., Akimov V., Henningsen J., Johansen P. T., Kratchmarova I., Kassem M., Mann M., Olsen J. V., Blagoev B. (2011). System-wide temporal characterization of the proteome and phosphoproteome of human embryonic stem cell differentiation. Sci. Signal. 4, rs3. - PubMed
-
- Dengjel J., Kratchmarova I., Blagoev B. (2009) Receptor tyrosine kinase signaling: a view from quantitative proteomics. Mol. Biosyst. 5, 1112–1121 - PubMed
-
- Peng J., Schwartz D., Elias J. E., Thoreen C. C., Cheng D., Marsischky G., Roelofs J., Finley D., Gygi S. P. (2003) A proteomics approach to understanding protein ubiquitination. Nat. Biotechnol. 21, 921–926 - PubMed
-
- Usaite R., Wohlschlegel J., Venable J. D., Park S. K., Nielsen J., Olsson L., Yates J. R., Iii (2008) Characterization of global yeast quantitative proteome data generated from the wild-type and glucose repression saccharomyces cerevisiae strains: the comparison of two quantitative methods. J. Proteome Res. 7, 266–275 - PMC - PubMed
Publication types
MeSH terms
LinkOut - more resources
Full Text Sources
Research Materials
