. 2011 May 20;30(13):2719-33.
doi: 10.1038/emboj.2011.158.

The androgen receptor fuels prostate cancer by regulating central metabolism and biosynthesis

Affiliations

The androgen receptor fuels prostate cancer by regulating central metabolism and biosynthesis

Charles E Massie et al. EMBO J. .

Abstract

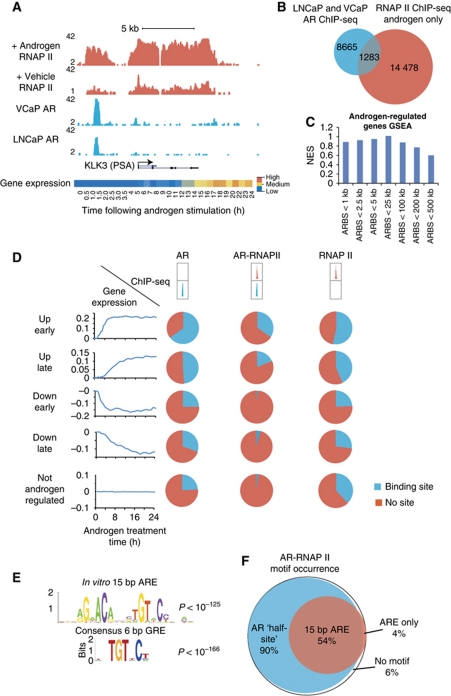
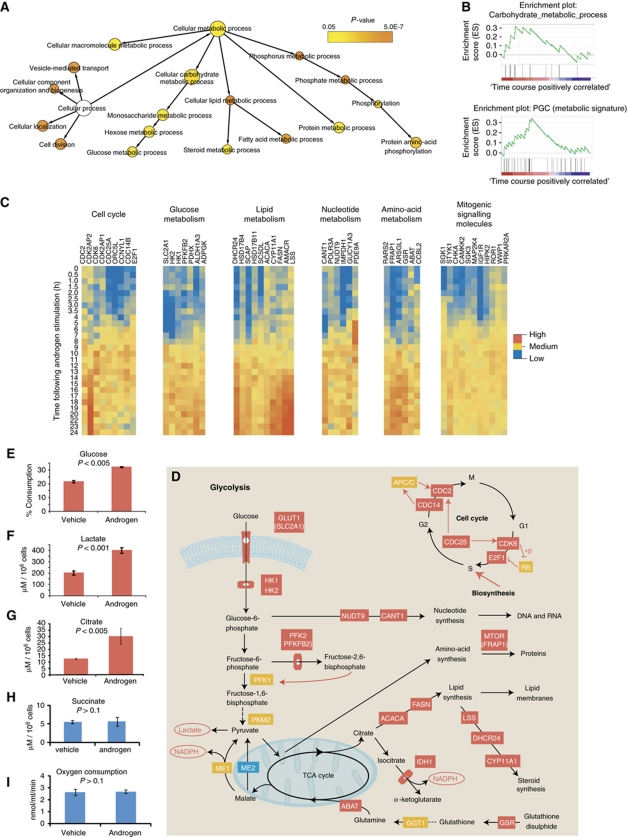
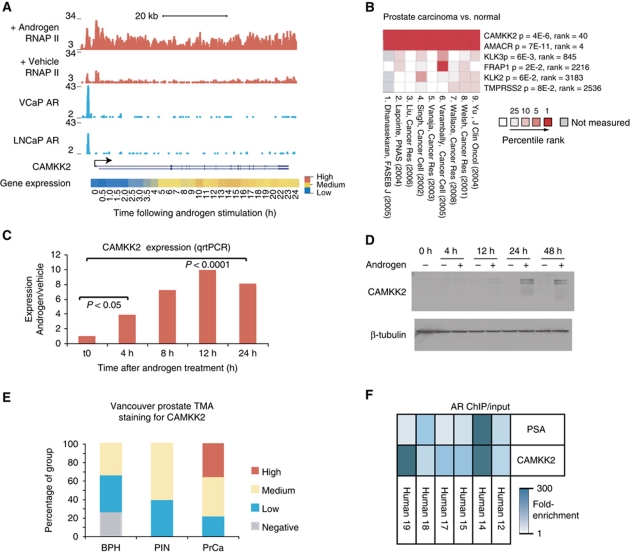
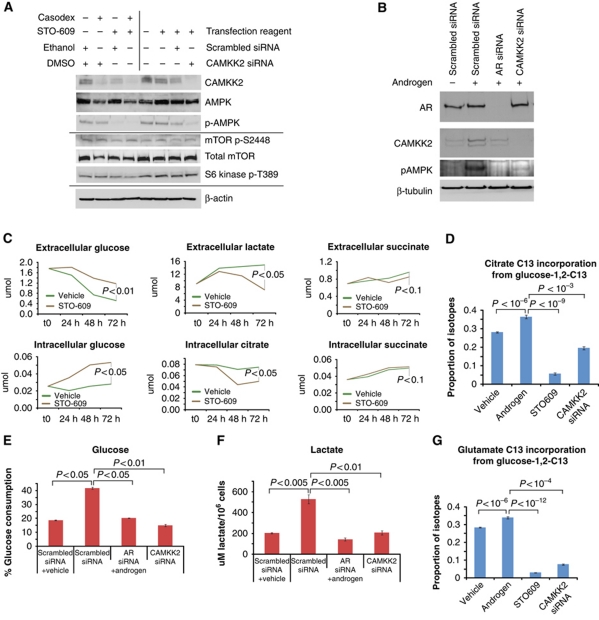
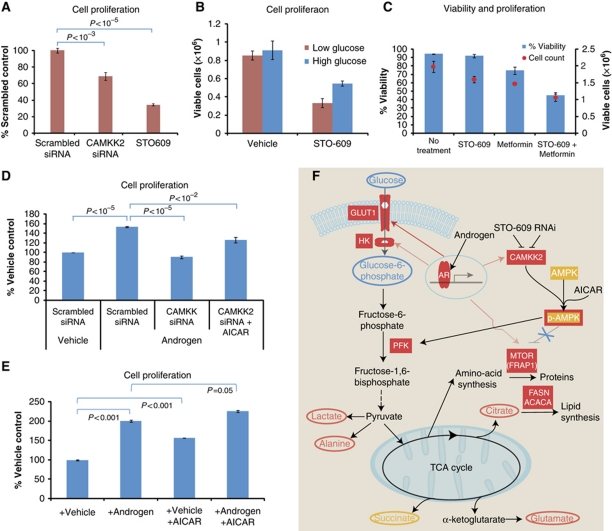
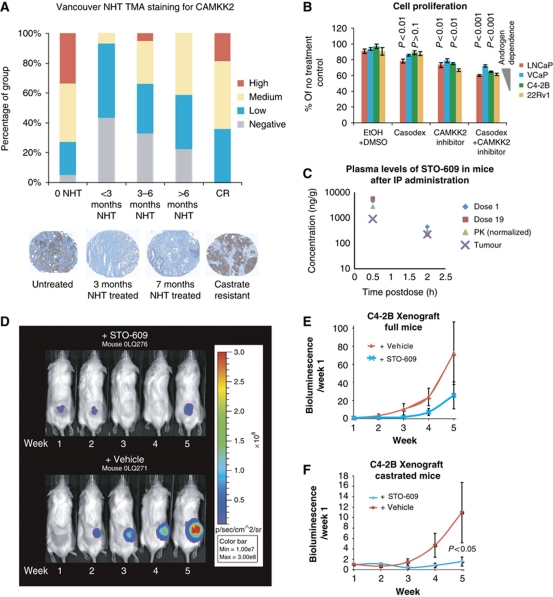
The androgen receptor (AR) is a key regulator of prostate growth and the principal drug target for the treatment of prostate cancer. Previous studies have mapped AR targets and identified some candidates which may contribute to cancer progression, but did not characterize AR biology in an integrated manner. In this study, we took an interdisciplinary approach, integrating detailed genomic studies with metabolomic profiling and identify an anabolic transcriptional network involving AR as the core regulator. Restricting flux through anabolic pathways is an attractive approach to deprive tumours of the building blocks needed to sustain tumour growth. Therefore, we searched for targets of the AR that may contribute to these anabolic processes and could be amenable to therapeutic intervention by virtue of differential expression in prostate tumours. This highlighted calcium/calmodulin-dependent protein kinase kinase 2, which we show is overexpressed in prostate cancer and regulates cancer cell growth via its unexpected role as a hormone-dependent modulator of anabolic metabolism. In conclusion, it is possible to progress from transcriptional studies to a promising therapeutic target by taking an unbiased interdisciplinary approach.


Conflict of interest statement

The authors declare that they have no conflict of interest.

Figures

Figure 1
Figure 1
Mapping transcriptional targets of the AR. (A) ChIP-seq enrichment profiles for AR and RNAP II with or without androgen treatment and in LNCaP or VCaP cells, as indicated (cells cultured in steroid depleted media and treated with 1 nM R1881 or 0.01% ethanol for 4 h). Location of the PSA gene is indicated below enrichment plots, arrow indicates the direction of transcription. Androgen-stimulated expression is shown at the bottom, represented as a heatmap showing expression changes with time following androgen stimulation (1 nM R1881, data from Illumina beadarray gene expression time course). (B) Venn diagram showing the overlap between AR binding sites and androgen-dependent RNAP II enriched genomic regions (1 nM R1881, 4 h; data from intersects of all peaks overlapping by >1 bp). (C) Gene set enrichment analysis (GSEA) of androgen-regulated genes (Illumina beadarray androgen stimulation time course), using gene sets identified within genomic windows from 1 to 500 kb from AR binding sites. (D) Combined analysis of AR binding sites, androgen-dependent RNAP II enriched regions and androgen-regulated genes. Genes are grouped by expression changes early (<4 h), late (>4 h), up, down or no change in response to androgen stimulation (left). Pie charts indicate the proportion of genes with adjacent AR, RNAP II or overlapping AR-RNAP II sites in each set (<25 kb from gene boundaries; groups indicated above). (E) Sequence logos for 15 and 6 bp AR/GR binding motifs (P-values indicate enrichment in AR-RNAP II overlapping regions). (F) Venn diagram showing the occurrence of 15 and 6 bp AR binding motifs in androgen-dependent AR-RNAP II overlapping sites.
Figure 2
Figure 2
Functional annotation of direct AR-regulated genes. (A) Gene ontology (GO) network of direct AR-regulated genes (androgen upregulated genes within 25 kb of AR binding site, Cytoscape BiNGO analysis). (B) Gene set enrichment analysis (GSEA) plots for direct AR-regulated genes, showing enrichment for carbohydrate metabolism GO and the curated peroxisome proliferator-activated receptor γ co-activator 1-α (PPARGC1A) metabolic gene set. (C) Gene expression heatmaps, showing androgen-regulated genes within 25 kb of an AR binding site, grouped by functional categories (indicated above; data from Illumina beadarray time course in LNCaP cells; pathway annotations from GO annotations, KEGG pathways and literature reviews). (D) Schematic showing the locations of direct AR-regulated genes in metabolic and cell-cycle pathways. Red boxes indicate direct AR upregulated genes, blue boxes represent direct AR downregulated genes and yellow boxes indicate proteins not found to be regulated by the AR. Dashed lines indicate intermediate steps not shown. (EI) Levels of (E) glucose, (F) lactate, (G) citrate, (H) succinate and (I) oxygen consumption rates were measured following growth of LNCaP prostate cancer cells in steroid depleted media with and without androgen stimulation (1 nM R1881). Expressed as μM lactate, μM citrate, μM succinate and % glucose consumption in cell culture media and nmol/ml/min oxygen consumption rate, all normalized to cell number (represented as mean±s.e.m.; each data point represents triplicate measurements).
Figure 3
Figure 3
The regulation and expression of CAMKK2 in prostate cancer. (A) ChIP-seq enrichment profiles for the AR (LNCaP and VCaP) and RNAP II (LNCaP), as indicated. The CAMKK2 gene position is indicated below, arrow indicates the direction of transcription. Androgen-regulated expression of CAMKK2 is shown in the heatmap below (data from Illumina beadarray time course in LNCaP cells). (B) Summary of gene expression data from nine separate studies using clinical samples showing the expression of six direct AR targets in prostate cancer compared with benign (represented as the percentile rank for each gene in each set and labelled with median gene rank and median P-value for each gene over all nine studies; data from Oncomine). (C) Real-time qrtPCR quantification of CAMKK2 transcript following androgen stimulation (LNCaP cells cultured in steroid depleted media and treated with1 nM R1881; data represented as average of triplicates±s.e.m.). (D) Western blotting for CAMKK2 and β-tubulin, using LNCaP cell lysates harvested following 72 h culture in steroid depleted media followed by treatment with either androgen (1 nM R1881) or vehicle (0.01% ethanol) for 4, 12, 24 or 48 h, as indicated. (E) Summary of CAMKK2 immunohistochemical staining of benign (BPH), prostate intraepithelial neoplasia (PIN) and prostate cancer (PrCa) (data from Vancouver prostate tissue microarray, n=84 cores). (F) Heatmap showing the results of AR ChIP from six individual clinical prostate cancer samples, with Real-time PCR detection of the CAMKK2 promoter and PSA (KLK3) enhancer regions (represented as fold-enrichment over total input DNA, normalized to unbound control locus).
Figure 4
Figure 4
CAMKK2-AMPK signalling and glucose metabolism downstream of the AR in prostate cancer cells. (A) Western blotting of lysates from LNCaP cells 72 h following treatment with AR antagonist (casodex), CAMKK2 inhibitor (STO-609), vehicle controls, CAMKK2 siRNA or scrambled control siRNA. (B) Western blotting of lysates from LNCaP cells 72 h after transfection of AR siRNA, CAMKK2 siRNA or scrambled control siRNA in the presence and absence of androgens (cells grown in steroid depleted media and treated with 1 nM R1881 or 0.01% ethanol). (C) Proton nuclear magnetic resonance (1H NMR) measurements of glucose, lactate and citrate in cell culture media (extracellular) or cell lysates (intracellular) from LNCaP cultures treated with CAMKK2 inhibitor (25 μM STO-609) or vehicle control (0.01% DMSO) for 24, 48 and 72 h, as indicated (average of triplicate experiments, normalized to cell counts). (D) Measurement of glucose flux to citrate using carbon-13-labelled glucose (1,2-13C2-glucose) and GC/MS. LNCaP cells were cultured for 72 h in the presence or absence of androgen stimulation (1 nM R1881) and with or without CAMKK2 inhibition (25 mM STO-609) or siRNA knock-down (represented as the proportion of citrate isotopes containing carbon-13; mean of triplicates±s.e.m.). (E, F) Extracellular glucose and lactate levels in LNCaP cell culture media 72 h following transfection of AR siRNA, CAMKK2 siRNA or scrambled control siRNA in the presence and absence of androgens (1 nM R1881 or 0.01% ethanol; concentrations measured using enzymatic assays, Abcam). (G) Measurement of glucose flux to glutamate using carbon-13-labelled glucose (1,2-13C2-glucose) and GC/MS. LNCaP cells were cultured for 72 h in the presence or absence of androgen (1 nM R1881 or 0.01% ethanol) and with or without CAMKK2 inhibition (25 μM STO-609) or CAMKK2 siRNA knock-down (represented the proportion of glutamate isotopes containing carbon-13; mean of triplicates±s.e.m.).
Figure 5
Figure 5
AR-CAMKK2-AMPK signalling is required for AR-stimulated proliferation in prostate cancer cells. (A) Cell proliferation of LNCaP cells 120 h following CAMKK2 siRNA transfection or CAMKK2 inhibitor treatment (25 μM STO-609; represented as % no treatment control, average of triplicate MTS assay experiments±s.e.m.). (B) Viable cell counts 72 h following treatment of LNCaP cells with CAMKK2 inhibitor (25 μM STO-609), in low glucose medium (1 g/l) or high glucose medium (4.5 g/l; represented as average of triplicate experiments±s.e.m.). (C) Viable cell counts and percentage viability of LNCaP cells following 72 h treatment with CAMKK2 inhibitor (25 μM STO-609), the anti-diabetes drug metformin (5 mM) or the combination treatment (average of triplicate experiments±s.e.m.). (D) Cell proliferation of LNCaP cells cultured in steroid depleted medium for 120 h following transfection with scrambled siRNA or CAMKK2 siRNA, with or without androgen stimulation (1 nM R1881) or AMPK activation (200 μM AICAR; average of triplicate MTS experiments±s.e.m.). (E) Cell proliferation of LNCaP cells cultured in steroid depleted medium for 120 h and treated with vehicle (0.01% ethanol) or androgen (1 nM R1881) with or without AMPK stimulation (200 μM AICAR; average of triplicate MTS experiments±s.e.m.). (F) Schematic model of AR-CAMKK2 signalling in prostate cancer cells, highlighting the pathways implicated in the stimulation of glycolysis, biosynthesis and proliferation via AMPK (upstream metabolites indicated in blue ovals, downstream metabolites indicated in red ovals and AR-regulated genes indicated by solid red boxes, yellow indicates metabolites and genes showing no detected change).
Figure 6
Figure 6
CAMKK2 expression and function under castrate conditions and in castrate-resistant prostate cancer. (A) Summary of CAMKK2 immunohistochemical (IHC) staining of a Neoadjuvant Hormone Therapy (NHT) tissue microarray (Vancouver NHT TMA) containing samples from hormone naive (0 NHT), NHT for <3 months, 3–6 months or >6 months and castrate-resistant prostate cancer (CR; as indicated; n=107 cores). Representative images of CAMKK2 staining from untreated, 3 and 7 month-treated and castrate-resistant prostate cancer TMA cores. (B) Cell proliferation of LNCaP, VCaP, C4-2B and 22Rv1 cells 72 h following treatment with AR antagonist (10 μM casodex), CAMKK2 inhibitor (25 μM STO-609) or the combined treatment, as indicated (represented as percentage of untreated control, average of triplicate experiments±s.e.m.). (C) Plasma and tumour levels of the CAMKK2 inhibitor STO-609 following intraperitoneal (IP) injection in C4-2B xenografted mice. Plasma harvested after the first treatment (dose 1), after the 19th treatment (dose 19), normalized pharmacokinetic (PK) and tumour measurements of STO-609 were quantified using mass spectroscopy (LC-MS/MS) relative to standard curve measurements. (D) Images of bioluminescent C4-2B xenograft tumours measured on week 1–5 from a single representative mouse from each treatment group. Mice were injected intraperitoneally three times per week with 10 μmol/kg of STO-609 or DMSO control (as indicated) and the growth of the tumours was monitored weekly using luciferase bioluminescence imaging. (E, F) Growth curve of bioluminescent C4-2B prostate cancer cell line xenografts (n=4 per group). Full (E) and castrated (F) mice were treated with the CAMKK2 inhibitor STO-609 (10 μmol/kg) or vehicle control (DMSO) three times per week and imaged once per week following IP injection of 150 mg/kg luciferin. Expressed as bioluminescence relative to week 1 for each mouse (represented as mean±s.e.m.).

Comment in

Similar articles

Cited by

References

    1. Anderson KA, Ribar TJ, Lin F, Noeldner PK, Green MF, Muehlbauer MJ, Witters LA, Kemp BE, Means AR (2008) Hypothalamic CaMKK2 contributes to the regulation of energy balance. Cell Metab 7: 377–388 - PubMed
    1. Attar RM, Jure-Kunkel M, Balog A, Cvijic ME, Dell-John J, Rizzo CA, Schweizer L, Spires TE, Platero JS, Obermeier M, Shan W, Salvati ME, Foster WR, Dinchuk J, Chen SJ, Vite G, Kramer R, Gottardis MM (2009) Discovery of BMS-641988, a novel and potent inhibitor of androgen receptor signaling for the treatment of prostate cancer. Cancer Res 69: 6522–6530 - PubMed
    1. Attard G, Reid AH, A'Hern R, Parker C, Oommen NB, Folkerd E, Messiou C, Molife LR, Maier G, Thompson E, Olmos D, Sinha R, Lee G, Dowsett M, Kaye SB, Dearnaley D, Kheoh T, Molina A, de Bono JS (2009) Selective inhibition of CYP17 with abiraterone acetate is highly active in the treatment of castration-resistant prostate cancer. J Clin Oncol 27: 3742–3748 - PMC - PubMed
    1. Bailey TL, Elkan C (1995) The value of prior knowledge in discovering motifs with MEME. Proc Int Conf Intell Syst Mol Biol 3: 21–29 - PubMed
    1. Barski A, Cuddapah S, Cui K, Roh TY, Schones DE, Wang Z, Wei G, Chepelev I, Zhao K (2007) High-resolution profiling of histone methylations in the human genome. Cell 129: 823–837 - PubMed

Publication types

MeSH terms

Associated data