. 2011 Jun;17(6):738-43.
doi: 10.1038/nm.2375. Epub 2011 May 22.

A clinical microchip for evaluation of single immune cells reveals high functional heterogeneity in phenotypically similar T cells

Affiliations

A clinical microchip for evaluation of single immune cells reveals high functional heterogeneity in phenotypically similar T cells

Chao Ma et al. Nat Med. 2011 Jun.

Abstract

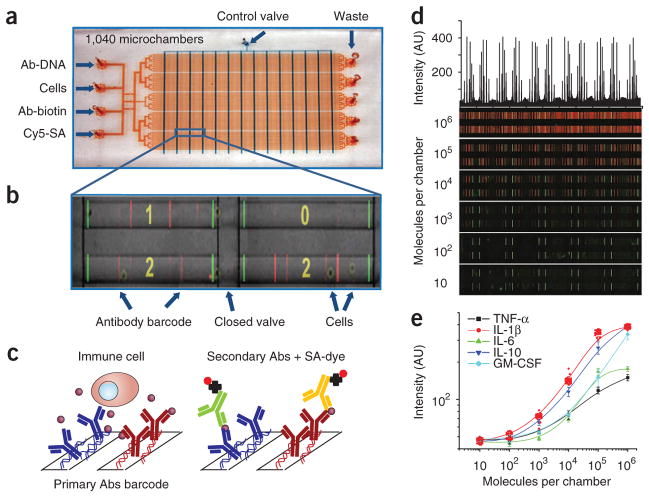
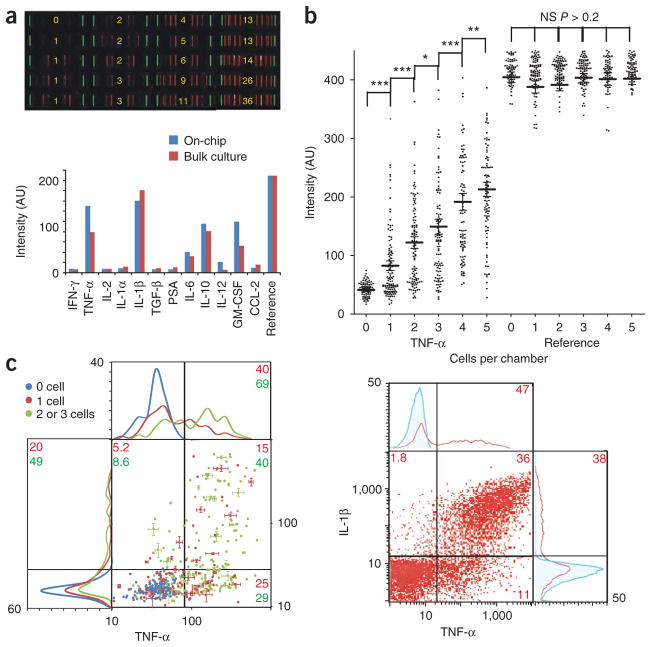
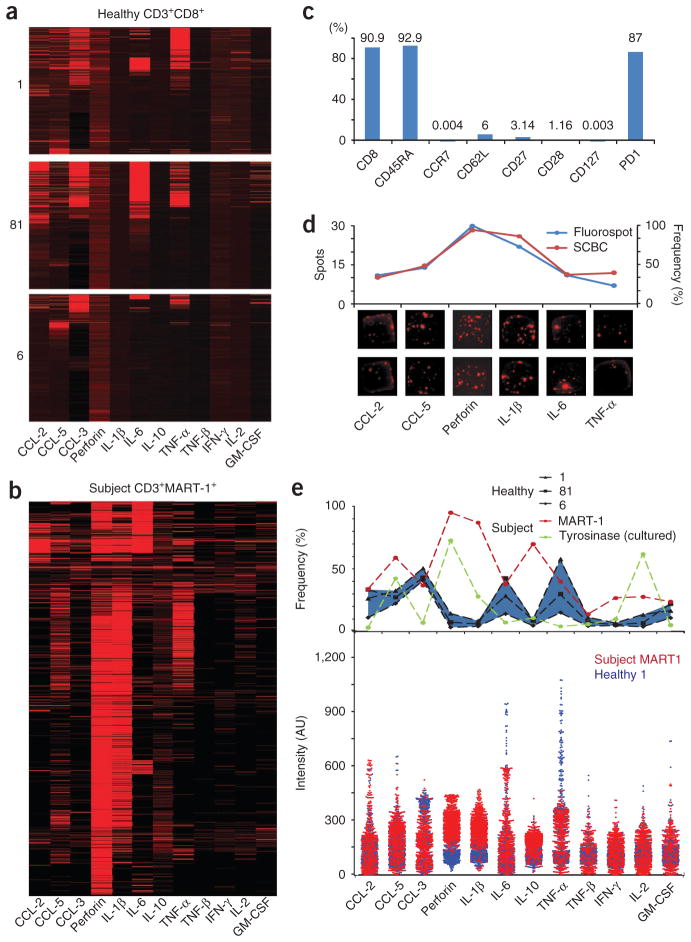
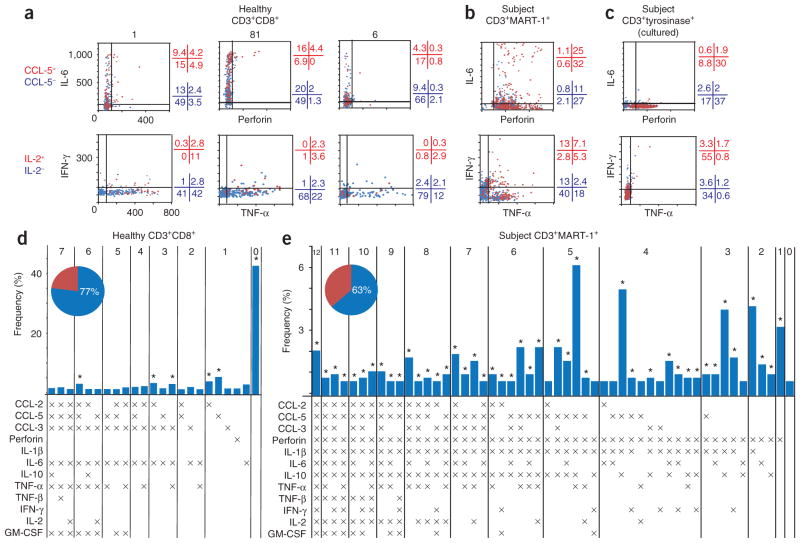
Cellular immunity has an inherent high level of functional heterogeneity. Capturing the full spectrum of these functions requires analysis of large numbers of effector molecules from single cells. We report a microfluidic platform designed for highly multiplexed (more than ten proteins), reliable, sample-efficient (∼1 × 10(4) cells) and quantitative measurements of secreted proteins from single cells. We validated the platform by assessment of multiple inflammatory cytokines from lipopolysaccharide (LPS)-stimulated human macrophages and comparison to standard immunotechnologies. We applied the platform toward the ex vivo quantification of T cell polyfunctional diversity via the simultaneous measurement of a dozen effector molecules secreted from tumor antigen-specific cytotoxic T lymphocytes (CTLs) that were actively responding to tumor and compared against a cohort of healthy donor controls. We observed profound, yet focused, functional heterogeneity in active tumor antigen-specific CTLs, with the major functional phenotypes quantitatively identified. The platform represents a new and informative tool for immune monitoring and clinical assessment.


Conflict of interest statement

COMPETING FINANCIAL INTERESTS

The authors declare no competing financial interests.

Figures

Figure 1
Figure 1
Design of the SCBC for single-cell protein secretome analysis. (a) Image of an SCBC in which flow channels are shown in red and the control channels are shown in blue. Input and output ports are labeled. Ab, antibody. (b) An optical micrograph showing cells loaded and isolated within the microchambers, overlaid with the fluorescence micrograph of the developed assay barcode for those same microchambers. Numbers of cells per microchamber are indicated by the yellow numbers. (c) Drawing of the multiplex DEAL primary antibody barcode array used for capture of secreted proteins from single cells and then developed for the detection of those proteins. SA, Streptavidin. (d) Scanned fluorescent images used for the antibody barcode calibration measurements using spiked recombinant proteins. The protein concentrations (in numbers of molecules per chamber) are given to the left of each row of images. The plot at the top is a line profile of the top row of images and represents the reproducibility of the barcodes across the antibody array of an SCBC. (e) Recombinant protein calibration curves for TNF-α, IL-1β, IL-6, IL-10 and GM-CSF. Individual measurements (red) are shown for IL-1β. Other proteins measurements are represented by average intensity values and s.d.
Figure 2
Figure 2
On chip secretion measurements of macrophage differentiated from THP-1 monocyte cell. (a) Top, representative scanned images of barcode signals from individual chambers. Green bars represent microchamber boundaries, red bars are protein signals and the yellow numbers indicate the number of cells. Bottom, comparison of averaged intensity from SCBC measurements and bulk culture supernatant. Data are normalized so that references have the same intensity. (b) Scatter plots of measured levels of TNF-α and the reference control for individual microchambers containing n = 0,1,2,3,4 or 5 cells. P values are calculated by comparing neighboring columns (*P < 0.005; **P < 0.001; ***P < 0.0001; NS, not significant). (c) Scatter plots of TNF-α versus IL-1β derived from SCBC measurements (left) and from ICS coupled with flow cytometry (right). Histograms (frequency versus intensity) for the individual protein are provided at the tops and sides of the scatter plots. All y axis units are fluorescence intensity. For the SCBC data, each quadrant is labeled with numbers that reflect the percentage of single cells (red) and two to three cells (green) in that section. The gates separating cytokine-secreting and nonsecreting cells are determined from 0 cell microchamber (background) measurements (blue). s.d. from barcode replicates of the same chamber are provided for selected points (see Results for selection criteria). For the ICS measurements, the gates were determined by isotype control staining.
Figure 3
Figure 3
Single-cell secretion measurements of CTLs from individuals with melanoma and healthy donors. (a) Unsupervised clustering of CD8+ T cells from three healthy donors, presented as a heat map. Each row represents a measurement of 12 secreted cytokines from a single cell, with protein labels provided at the bottom. (b) Data from MART-1–specific TCR–transgenic CTL single-cell experiments, presented as a heat map organized via unsupervised clustering. The fluorescence intensity scale for all four heat maps is the same. (c) Phenotyping data from flow cytometry for MART-1–specific TCR–transgenic CTLs. Each bar shows the percentage of cells positive for the specific surface marker. (d) Fluorospot analysis of the MART-1–specific TCR–transgenic T cell population. The curves on top compare SCBC and Fluorospot measurements on fraction (or number) of cells secreting CCL-2, CCL-5, perforin, IL-1β, IL-6 and TNF-α. Representative Fluorospot images are provided at the bottom. (e) Univariate comparison of antigen-specific TCR–transgenic T cells from a subject with melanoma and healthy donor CD8+ T cell culture controls. The lines of the top plot represent the percentage of cytokine-producing cells from each sample. Blue area shows the range detected from healthy donor samples. The one-dimensional scatter plot on the bottom compares the signal intensities measured from the subject’s MART-1–specific TCR–transgenic T cells and the CD8+ T cell background from one representative healthy donor.
Figure 4
Figure 4
Polyfunctional diversity analysis for CTLs from a subject with metastatic melanoma and from healthy donors. (ac) Pseudo–three-dimensional scatter plots for representative single-cell cytokine measurements from CD8+ T cells. Top and bottom rows are correlations for perforin versus IL-6 and TNF-α versus IFN-γ, respectively. The third dimension (CCL-5 or IL-2) is projected to the two-dimensional plot by using red for positive cells and blue for negative cells. Numbers on the right show percentage in each quadrant. Samples are labeled on the left. (d,e) Functional diversity plots for the subject’s MART-1–specific TCR–transgenic cells and CD8+ T cells from a representative healthy donor. Each major functional subset identified (with frequency >0.5%) is shown by an individual bar. The bar heights represent population percentages. Fifty-three major subsets were identified from the MART-1–specific TCR–transgenic cells; 23 were identified from the healthy donor. The number at the top of the plot is the number of functions associated with each subset. The matrix at the bottom provides the function detail (×: positive). The pie charts give the percentage of cells that fell into one of the major functional subsets. Asterisks above the blue bars denote those subsets within the most frequent 60% of the population.

References

    1. Gordon S, Taylor PR. Monocyte and macrophage heterogeneity. Nat Rev Immunol. 2005;5:953–964. - PubMed
    1. O’Shea JJ, Hunter CA, Germain RN. T cell heterogeneity: firmly fixed, predominantly plastic or merely malleable? Nat Immunol. 2008;9:450–453. - PubMed
    1. Kaech SM, Wherry EJ. Heterogeneity and cell-fate decisions in effector and memory CD8+ T cell differentiation during viral infection. Immunity. 2007;27:393–405. - PMC - PubMed
    1. Darrah PA, et al. Multifunctional TH1 cells define a correlate of vaccine-mediated protection against Leishmania major. Nat Med. 2007;13:843–850. - PubMed
    1. Lee PP, et al. Characterization of circulating T cells specific for tumor-associated antigens in melanoma patients. Nat Med. 1999;5:677–685. - PubMed

Publication types