. 2011 Jun;17(6):692-9.
doi: 10.1038/nm.2387. Epub 2011 May 22.

Iduna protects the brain from glutamate excitotoxicity and stroke by interfering with poly(ADP-ribose) polymer-induced cell death

Affiliations

Iduna protects the brain from glutamate excitotoxicity and stroke by interfering with poly(ADP-ribose) polymer-induced cell death

Shaida A Andrabi et al. Nat Med. 2011 Jun.

Abstract

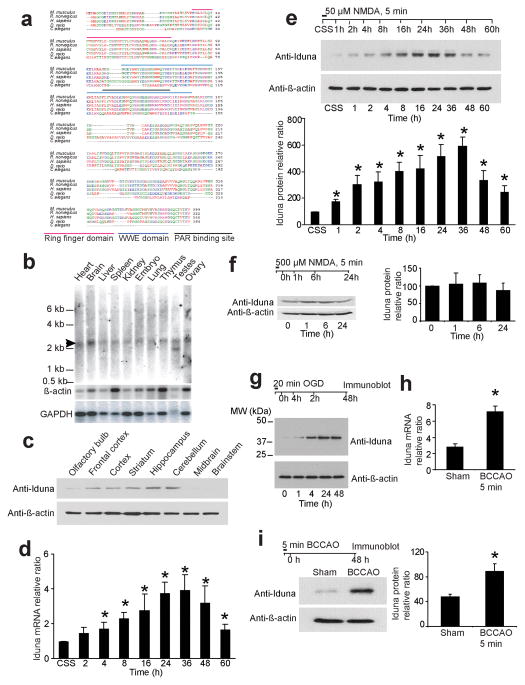
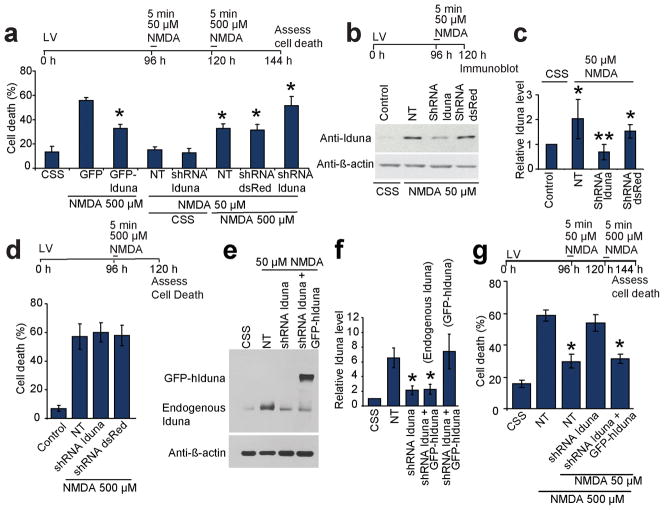
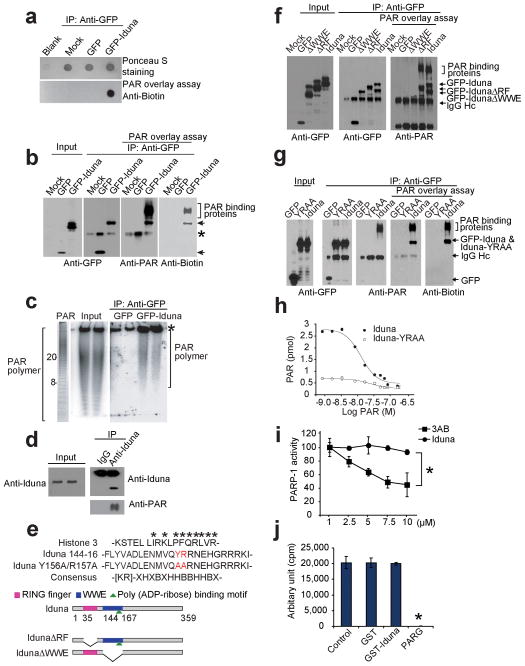
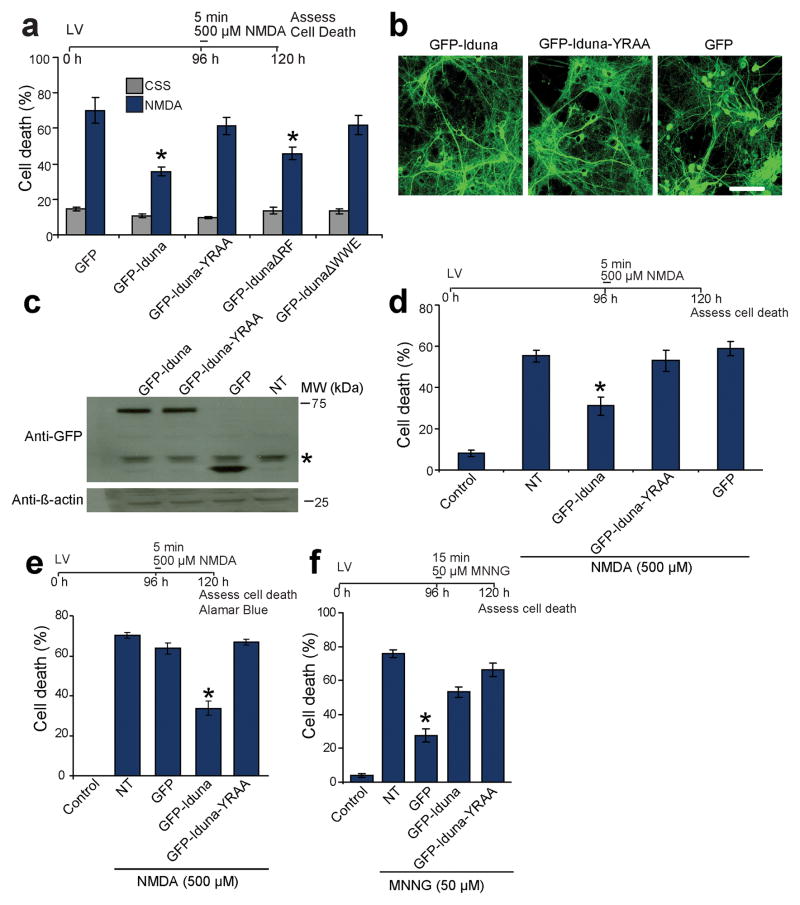
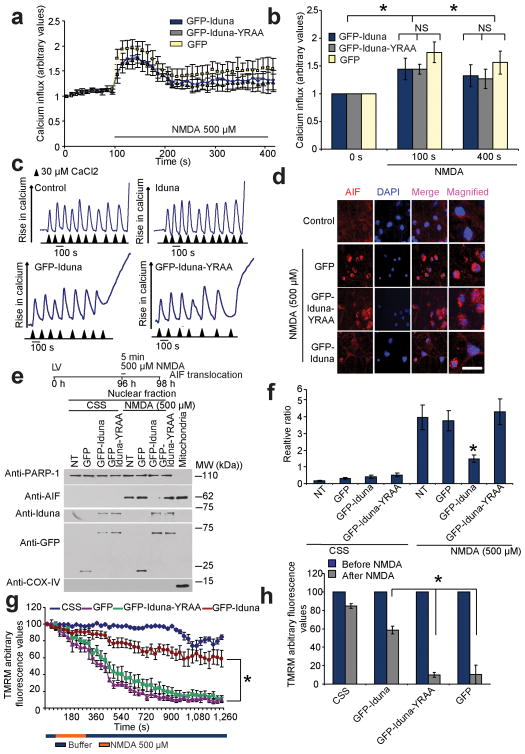
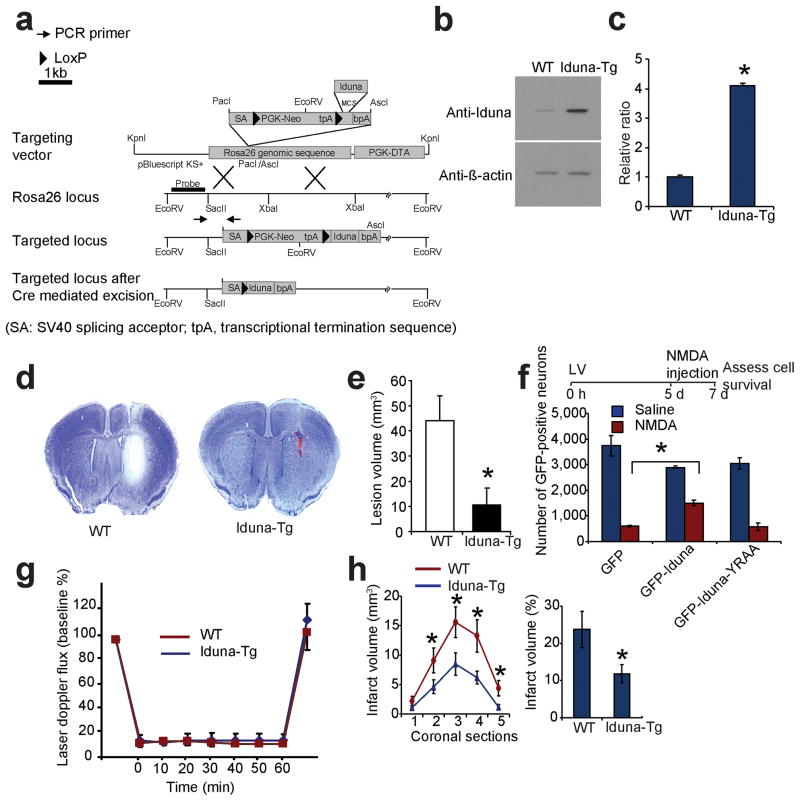
Glutamate acting on N-methyl-D-aspartate (NMDA) receptors induces neuronal injury following stroke, through activation of poly(ADP-ribose) polymerase-1 (PARP-1) and generation of the death molecule poly(ADP-ribose) (PAR) polymer. Here we identify Iduna, a previously undescribed NMDA receptor-induced survival protein that is neuroprotective against glutamate NMDA receptor-mediated excitotoxicity both in vitro and in vivo and against stroke through interfering with PAR polymer-induced cell death (parthanatos). Iduna's protective effects are independent and downstream of PARP-1 activity. Iduna is a PAR polymer-binding protein, and mutation at the PAR polymer binding site abolishes the PAR binding activity of Iduna and attenuates its protective actions. Iduna is protective in vivo against NMDA-induced excitotoxicity and middle cerebral artery occlusion-induced stroke in mice. To our knowledge, these results define Iduna as the first known endogenous inhibitor of parthanatos. Interfering with PAR polymer signaling could be a new therapeutic strategy for the treatment of neurologic disorders.


Figures

Figure 1
Figure 1
Iduna is an NMDA induced neuroprotective protein. (a) Amino acid sequences of Iduna proteins are conserved among different species. (b) Northern analysis of Iduna (arrow) in mouse tissue. β-actin and GAPDH are loading controls. (c) Immunoblot analysis of Iduna protein expression in different regions of brain. β-actin is a loading control. Data were repeated with similar results. (d) Induction of Iduna mRNA by 50 μM NMDA detected by RT-PCR in primary neuronal cultures over time. Data are the mean ± SEM from two experiments. (e) Immunoblot of Iduna induced by 50 μM NMDA (upper panel). These data were normalized to β-actin and quantified by optical density (bottom panel). Data are the mean ± SEM from three experiments. (f) Immunoblots of Iduna expression following an excitotoxic 500 μM dose of NMDA in primary cortical neurons. The data were normalized to β-actin and quantified by optical density (side panel). Data are the mean ± SEM from two experiments. (g) Immunoblot of Iduna expression over time following induction by 20 min of oxygen glucose deprivation (OGD) in primary cortical cultures. Experiments were repeated three times. (h) Iduna mRNA expression in mouse forebrain detected by RT-PCR 48 hr after reperfusion following 5 min bilateral carotid artery occlusion (BCCAO). Data are the mean ± SEM, n=4. (i) Immunoblot of Iduna expression in forebrain 48 hr after reperfusion following 5 min BCCAO. Data were normalized to β-actin and quantified by optical density (right panel). Data represents mean ± SEM, n=4. Experimental schedule is indicated above panels and treatment conditions are indicated by horizontal bars. Significance determined by by ANOVA with Tukey-Kramer’s posthoc test.
Figure 2
Figure 2
Iduna is neuroprotective. (a) Primary cortical neurons expressing GFP or Iduna-GFP were exposed to excitotoxic NMDA (500 μM, 5 min). Sister cultures expressing shRNA to Iduna (shRNA-Iduna) or dsRed (shRNA dsRed) were exposed to 50 μM NMDA and then 500 μM NMDA. Abbreviation: NT, not transduced. Data represent mean ± SEM, n = 5 from two experiments; *p < 0.05. (b) Immunoblot of Iduna expression in cortical cultures expressing shRNA Iduna or shRNA dsRed exposed to 50 μM NMDA. (c) Quantification of the data in (b) normalized to β-actin. Data are the mean ± SEM from three experiments, *p < 0.05 vs control, **p < 0.05 vs. NT. (d) Primary cortical cultures expressing shRNA Iduna or shRNA dsRed were challenged with 500 μM NMDA. Data are the mean ± SEM of at least two experiments. (e) Immunoblot of Iduna expression in primary cortical cultures exposed to 50 μM NMDA in the presence of shRNA to mouse Iduna and expression of human Iduna (hIduna). (f) Quantification of (e) normalized to β-actin. Data represent mean ± SEM, n = 4; *p < 0.05. (g) Primary cortical cultures expressing lentivirus shIduna ± human Iduna (hIduna), which is resistant to mouse Iduna shRNA were exposed to NMDA as indicated. Data represent mean ± SEM, n = 4 from 4 experiments; *p < 0.05. Experimental schedule is indicated above panels and treatment conditions are indicated by horizontal bars. Significance determined by by ANOVA with Tukey-Kramer’s posthoc test.
Figure 3
Figure 3
PAR binding activity of Iduna. (a) Dot blot of immunoprecipitated GFP-Iduna and GFP with biotin-labeled PAR polymer and detected with anti-biotin antibody. Data were reproduced with similar results. (b) Far western analysis of Iduna PAR binding activity. Arrows indicate GFP-Iduna fusion protein and bracket indicates PAR binding proteins. Asterisk indicates a IgG heavy chain signal recognized by polyclonal antibodies including the GFP or PAR antibodies. Data were reproduced with similar results. (c) [32P]-PAR polymer bound to GFP-Iduna or GFP analyzed in Trisborate-EDTA PAGE. Values represent ADP-ribose units in the PAR polymer. Asterisk indicates non-specific PAR polymer binding. (d) Immunoblot of endogenous Iduna and PAR from cortical neurons treated with 50 μM NMDA. These experiments were repeated at least two times with similar results. (e) Alignment of the PAR binding motif in Iduna and Histone 3. The Iduna Y156A/R157A PAR binding mutant (red) is indicated. Schematic of Iduna functional domains and deletion mutants. Ring finger (RF) domain (AA 35–77) [pink bar], WWE domain (AA 91–167) [blue bar] and the PAR binding domain (144–167) [green triangle] are highlighted. Full-length Iduna, and RF (IdunaΔRF) and WWE (IdunaΔWWE) domain deletion mutants of Iduna are shown. (f) Far western analysis of PAR binding activity of Iduna and Iduna deletion mutants. Arrows indicate GFP-Iduna fusion proteins and bracket indicates PAR binding proteins. IgG heavy chain (IgG Hc) is indicated by arrow. n=2 (g) Far western analysis of PAR binding activity of Iduna and Iduna-YRRA mutant. Arrows indicate GFP-Iduna fusion proteins and bracket indicates PAR binding proteins. (h) Analysis of PAR binding properties of wild type Iduna (●) and Iduna-YRAA mutant (○). (i) Chemiluminescent activity of PARP-1 in the presence of Iduna or the PARP-1 inhibitor 3-aminobenzamide (3-AB). Data represent two separate experiments. *p < 0.05 (j) Quantification of [32P]-PAR polymers synthesized by PARP-1 in the presence of GST, GST-Iduna or PARG (which catalytically degrades PAR), respectively. Data represent mean ± SEM, n=3 *p < 0.05 by ANOVA with Tukey-Kramer’s posthoc test.
Figure 4
Figure 4
PAR-binding property of Iduna mediates neuroprotection. (a) Quantification of 500 μM NMDA induced cell death in primary cortical neurons transciently transfected to express GFP, GFP-Iduna, GFP-Iduna-YRAA, GFP-IdunaΔRF or GFP-IdunaΔWWE. Cells with fragmented processes were considered dead. Data represent mean ± SEM, n=6 from two independent experiments, *p < 0.05 by ANOVA with Tukey-Kramer’s posthoc test. (b) Representative photomicrographs of lentiviral expression of GFP, GFP-Iduna or GFP-Iduna-YRAA in primary cortical neurons. n=4, scale bar = 50 μm (c) Immunoblots of lentiviral expression of GFP, GFP-Iduna or GFP-Iduna-YRAA in primary cortical neurons. No signal is seen in control cultures (*) non-specific band. Data were repeated three times with similar results. (d) Quantification of 500 μM NMDA induced cell death in primary cortical neurons with lentiviral expression of GFP, GFP-Iduna or GFP-Iduna-YRAA. Control cultures were treated with control salt solution (CSS) alone. NT, non-transduced. n=12–20 from two experiments. *p < 0.05 (e) Quantification of cell death in cortical neurons treated in an identical manner to panel 4d but cell death was assessed via AlamarBlue® reduction assay. Data represents mean ± SEM, n=5, *p < 0.05 by ANOVA with Tukey-Kramer’s posthoc test. (f) Quantification of cell death due to DNA damage by MNNG in primary neuronal cultures expressing GFP, GFP-Iduna or GFP-Iduna YRAA. Data represent mean ± SEM, n = 5 of two experiments. *p ≤ 0.05 by ANOVA with Tukey-Kramer’s posthoc test.
Figure 5
Figure 5
Iduna does not interfere with NMDA-induced changes in Ca2+ or mitochondrial Ca2+ loading, but prevents AIF translocation and reductions in mitochondrial membrane potential (Δψm). (a) Ca2+ influx imaged in primary cortical neurons expressing GFP, GFP-Iduna or GFP-Iduna-YRAA assessed by the Ca2+-sensitive fluorochrome fluo-5F (2.0 μM) over time. Intensity gain in these neurons was reduced to avoid saturation effects because of the spectral overlap between GFP and fluo-5F. (b) Graphic representation of Ca2+ influx before and after 500 μM NMDA. *p < 0.05 by ANOVA with Tukey-Kramer’s posthoc test. (c) Assessment of mitochondrial Ca2+ uptake in isolated mitochondria incubated with or without recombinant Iduna protein (top panels) or digitonin permeabilized MCF7 cells expressing GFP-Iduna or GFP-Iduna-YRAA (bottom panels), using Calcium green-5N as an indicator of free Ca2+. Experiments were repeated twice with similar results (d) Representative confocal photomicrographs of NMDA-induced AIF translocation in cortical neurons expressing GFP, GFP-Iduna or GFP-Iduna-YRAA. AIF immunoreactivity (red), DAPI (blue) scale bar = 20 μm (e) Immunoblot analysis of subcellular fractionations from cortical cultures treated as indicated in (d) for AIF. PARP-1, nuclear fraction, COX IV post-nuclear mitochondrial fraction. Data were repeated three times with similar results. (f) Quantification of AIF immunoblot analysis in (e). Data are the mean ± SEM from three experiments, *p < 0.05 vs NT after NMDA treatment by ANOVA with Tukey-Kramer’s posthoc test. (g) Analysis of Δψm, using TMRM live imaging in primary cortical neurons expressing GFP, GFP-Iduna or GFP-Iduna-YRAA. Neurons were treated with either 500 μM NMDA or CSS, *p < 0.05 (h) Graph shows loss of Δψm (TMRM fluorescence) before and after 20 min of NMDA application. *p < 0.05. Significance determined by ANOVA with Tukey-Kramer’s posthoc test.
Figure 6
Figure 6
Iduna is neuroprotective in vivo. (a) Targeting strategy for ROSA26-Iduna conditional transgenic (Tg) mouse. (b) Immunoblot of Iduna expression in wild type (WT) and Iduna-Tg mice. (c) Quantification of (b). Data represent mean ± SEM, n = 6; *p < 0.05 by Student’s t-test. (d) Representative coronal sections stained with nissl to reveal lesions in control (left) and Iduna-Tg (right) mice 48 h after intrastriatal injections with NMDA (20 nmoles). (e) Quantification of the lesion-volume. Data represent mean ± SEM, n = 4; *p < 0.05 by Student’s t-test. (f) Stereological counts of GFP-positive neurons from mouse brain injected with GFP, GFP-Iduna or GFP-Iduna-YRAA lentivirus followed by NMDA (20 nmoles) or normal saline. Quantification of GFP-positive surviving neurons. Data represent mean ± SEM, n=4 from two experiments; *p < 0.05 by ANOVA with Tukey-Kramer’s posthoc test. (g) Laser-Doppler flux measured over the lateral parietal cortex in the core of the ischemic region in WT (n=10) and Iduna-Tg (n=11) mice. Values are mean ± SEM, expressed as a percent of the pre-ischemic baseline values. (h) Brain infarct volume after 60 min of middle cerebral artery occlusion in WT (n=10) and Iduna Tg (n=11) mice. Left panel, *two-way analysis of variance indicated a significant overall effect of genotype among the five coronal levels (level 1 is most anterior), and the Holm-Sidak multiple comparison procedure indicated significant differences at coronal levels 3 and 4 where infarct volume was greatest. Mean ± S.E.M. Right panel, total infarct volume expressed as a percent of the entire ischemic hemisphere. * p < 0.05 from WT Student’s t-test. The time course of the various experiments are indicated at top of the panels.

References

    1. Aarts MM, Tymianski M. Molecular mechanisms underlying specificity of excitotoxic signaling in neurons. Curr Mol Med. 2004;4:137–147. - PubMed
    1. Waxman EA, Lynch DR. N-methyl-D-aspartate Receptor Subtypes: Multiple Roles in Excitotoxicity and Neurological Disease. Neuroscientist. 2005;11:37–49. - PubMed
    1. David KK, Andrabi SA, Dawson TM, Dawson VL. Parthanatos, a messenger of death. Front Biosci. 2009;14:1116–1128. - PMC - PubMed
    1. Wang Y, Dawson VL, Dawson TM. Poly(ADP-ribose) signals to mitochondrial AIF: a key event in parthanatos. Exp Neurol. 2009;218:193–202. - PMC - PubMed
    1. Yu SW, Wang H, Dawson TM, Dawson VL. Poly(ADP-ribose) polymerase-1 and apoptosis inducing factor in neurotoxicity. Neurobiol Dis. 2003;14:303–317. - PubMed

Publication types

MeSH terms