. 2011 May 22;12(7):647-54.
doi: 10.1038/ni.2033.

A cascade of protein kinase C isozymes promotes cytoskeletal polarization in T cells

Affiliations

A cascade of protein kinase C isozymes promotes cytoskeletal polarization in T cells

Emily J Quann et al. Nat Immunol. .

Abstract

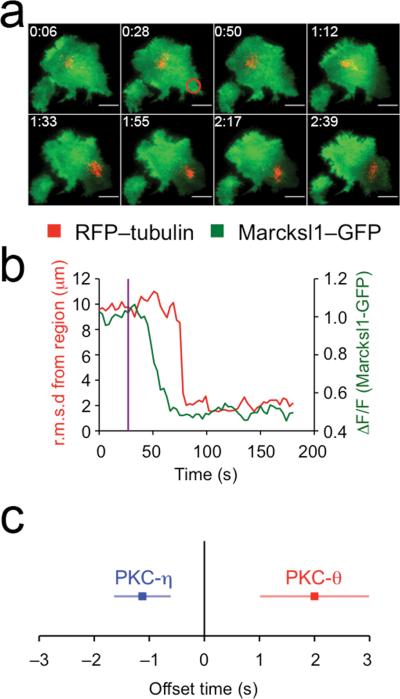
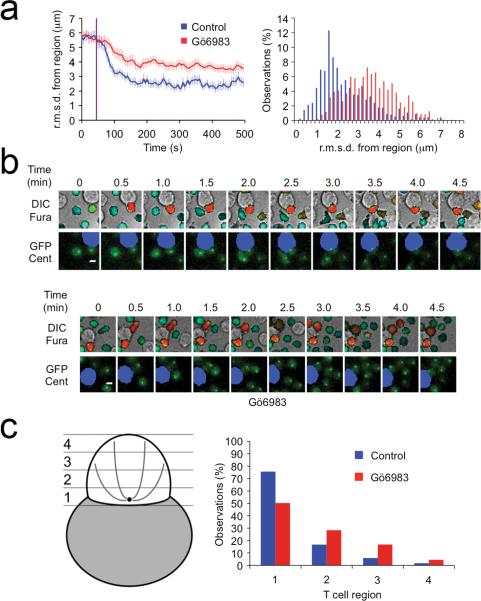
Polarization of the T cell microtubule-organizing center (MTOC) toward the antigen-presenting cell (APC) is driven by the accumulation of diacylglycerol (DAG) at the immunological synapse (IS). The mechanisms that couple DAG to the MTOC are not known. By single-cell photoactivation of the T cell antigen receptor (TCR), we found that three distinct isoforms of protein kinase C (PKC) were recruited by DAG to the IS in two steps. PKC-ɛ and PKC-η accumulated first in a broad region of membrane, whereas PKC-θ arrived later in a smaller zone. Functional experiments indicated that PKC-θ was required for MTOC reorientation and that PKC-ɛ and PKC-η operated redundantly to promote the recruitment of PKC-θ and subsequent polarization responses. Our results establish a previously uncharacterized role for PKC proteins in T cell polarity.


Figures

Figure 1
Figure 1
PKC-θ, PKC-ε, and PKC-η, but not PKC-δ, accumulate at the region of TCR activation prior to MTOC reorientation. 5C.C7 T cells expressing RFP–tubulin together with GFP-labeled PKC-θ (a), PKC-ε (b), PKC-η (c) or PKC-δ (d) were imaged on coverslips coated with photoactivatable pMHC and stimulated in defined regions with a pulse of UV light. Throughout the paper, fusion protein names indicate the position of the fluorescent label relative to the protein of interest (e.g. RFP–tubulin = RFP N-terminal to tubulin). In each panel, a representative timelapse montage (~30 s intervals) is shown to the left with the time and position of UV irradiation indicated by a red oval. Corresponding quantification is shown to the right with PKC accumulation expressed as normalized mean fluorescence intensity (ΔF/F) within the irradiated region and MTOC reorientation expressed as root mean square distance (r.m.s.d.) between the MTOC and the irradiated region. UV irradiation is indicated in graphs by a purple line. Throughout the figure, scale bars = 5 μm. All data are representative of at least two independent experiments, with n ≥ 6 cells per experiment.
Figure 2
Figure 2
nPKCs display distinct accumulation patterns and kinetics. TCR photoactivation was performed using 5C.C7 T cells expressing all three pairwise combinations of PKC-θ, PKC-ε, and PKC-η. Each pair of proteins was imaged using TIRF microscopy in two fluorescent configurations (e.g. PKC-θ–GFP with PKC-η–RFP, and PKC-η–GFP with PKC-θ–RFP). (a) Timelapse montages (~30 s intervals) showing representative accumulation behavior, with the time and position of UV irradiation events indicated by magenta ovals. Scale bars = 5 μm. (b) Left, mean width ratios for each pairwise combination of nPKCs determined after autocorrelation analysis (see Methods). Data points represent the average ratio over an entire timelapse (160 timepoints) for one cell. Each data set comprises 12 cells. Asterisks indicate P-values < 0.0001 (Student's T-test). Right, histogram computed using all width ratios from the entire data set. (c) Average “offset” times separating the recruitment of PKC-θ, PKC-ε, and PKC-η from MTOC reorientation, determined from cells expressing GFP-labeled PKCs with RFP–tubulin. (d) Offset times separating PKC-ε and PKC-η recruitment from PKC-θ recruitment, determined from cells expressing either labeled PKC-ε or PKC-η together with labeled PKC-θ. (e) Offset time separating PKC-ε recruitment from PKC-η recruitment, determined from cells expressing labeled PKC-ε with labeled PKC-η. Offset times were calculated using crosscorrelation curves from at least 15 paired responses (see Methods). Throughout the figure, error bars = standard error of the mean (s.e.m.). All data are representative of at least two independent experiments.
Figure 3
Figure 3
nPKC recruitment correlates with increased PKC activity. (a,b) TCR photoactivation experiments were performed using 5C.C7 T cells expressing Marcksl1–GFP and RFP–tubulin. (a) Representative timelapse montage (~20 s intervals), with the time and position of UV irradiation indicated by a red oval. Scale bars = 5 μm. (b) Quantification of the response in (a), showing Marcksl1–GFP depletion together with MTOC reorientation, presented as described in Fig. 1. (c) Average offset times separating PKC-η–GFP and PKC-θ–GFP recruitment from Marcksl1–RFP depletion (time 0). Offsets were determined by crosscorrelation analysis of at least 12 paired responses. Error bars = s.e.m. All data are representative of at least two independent experiments, with n ≥ 6 cells per experiment.
Figure 4
Figure 4
PKC activity is required for MTOC polarization. (a) 5C.C7 T cells expressing GFP–tubulin were photoactivated in the presence or absence of 500 nM Gö6983. Left, average r.m.s.d. between the MTOC and the irradiated region (called the average path) as a function of time. UV irradiation, which occurred after 50 s, is denoted by the purple line. Error bars indicate s.e.m. at each point. Right, distribution of distances between the MTOC and the center of the irradiated region (called a polarization histogram) for all observations after 4 min. Each experiment was 8 min in length. Curves were derived from at least 20 cells each. Data are representative of two independent experiments. (b,c) 5C.C7 T cells expressing GFP–Centrin-2 were loaded with the calcium indicator Fura-2AM and mixed with APCs in the presence of either 500 nM Gö6983 or vehicle control (DMSO). (b) Representative timelapse montages (0.5 min intervals) showing control (above) and Gö6983-treated (below) cells. Each GFP–Centrin-2 image is paired with a corresponding differential interference contrast (DIC) image. Ratiometric Fura-2 signal (warmer colors indicate higher intracellular Ca2+) is overlaid on each DIC image. The relevant APC is colored blue in each GFP–Centrin-2 image. (c) Quantification of MTOC polarization. For each observation, the MTOC was assigned to one of four positional bins (left), generating a distribution of MTOC positions for the entire data set (right). A total of 15 DMSO-treated control cells (287 observations) and 9 Gö6983-treated cells (155 observations) were analyzed. Data are representative of one experiment.
Figure 5
Figure 5
PKC-θ and either PKC-ε or PKC-η are required for MTOC polarization. 5C.C7 T cells expressing GFP–Centrin-2 were nucleofected with siRNA against the indicated proteins and used for TCR photoactivation studies. (a) Immunoblot validation of PKC knockdown by siRNA. The proteins targeted by siRNA in each sample are listed above the blots, and the proteins detected by antibodies are listed to the left of the blots. NT = nontargeting siRNA control. (b,c) MTOC polarization in cells nucleofected with siRNA against PKC-θ (b) PKC-ε (c), PKC-η (c), or PKC-ε and PKC-η together (c). Average path and polarization histogram analyses were performed as described in Fig. 4a. All curves were derived from at least 12 cells. Data are representative of at least three independent experiments.
Figure 6
Figure 6
Prkcq-/- T cells are defective in MTOC polarization. (a) TCR photoactivation experiments were performed using GFP–tubulin expressing 5C.C7 T cells derived from Prkcq-/- mice, Prkcq+/- littermate controls, or wild-type mice as indicated. Average path and polarization histogram analyses of MTOC reorientation were carried out as described in Fig. 4a. Curves were derived from at least 17 cells. Data are representative of two independent experiments in which cells were stimulated with ~50% less UV light than in typical photoactivation studies. (b) 5C.C7 T cells with the indicated PKC-θ genotype were transduced with exogenous (exo.) PKC-θ–RFP and used for TCR photoactivation studies. MTOC polarization in cells transduced with PKC-θ–RFP and in untransduced control cells was analyzed by average path as described in Fig. 4a. Curves were derived from at least 21 cells. Data are representative of three independent experiments.
Figure 7
Figure 7
PKC-ε and PKC-η are required for PKC-θ recruitment. 5C.C7 T cells expressing PKC-θ–GFP (a), PKC-η–GFP (b), or the C1 region of PKC-θ fused to GFP (C1–GFP) (c), were nucleofected with siRNA against the indicated proteins and used for TCR photoactivation studies. Left, normalized mean fluorescence intensity (ΔF/F) of the indicated GFP-labeled protein was plotted versus time, with UV irradiation indicated by the purple line. Right, immunoblot validation of PKC knockdown by siRNA. The proteins targeted by siRNA in each sample are listed above the blots, and the proteins detected by antibodies are listed to the left of the blots. NT = nontargeting siRNA control. All curves were derived from at least 13 cells. Throughout the figure, error bars = s.e.m. All data are representative of at least two independent experiments.
Figure 8
Figure 8
PKC-θ, PKC-ε, and PKC-η are required for TCR-induced cytokine production. (a) 5C.C7 T cell blasts were nucleofected with the indicated siRNA duplexes and then stimulated with immobilized MCC–I-Ek. Left, histogram plots showing induced IL-2 (top) and IFN-γ (bottom) production quantified by intracellular cytokine staining. Unstimulated samples are graphed as shaded curves. Right, dose response curves showing the fraction of IL-2+ (top) and IFN-γ+ (bottom) cells as a function of the concentration of MCC–I-Ek used to prepare the stimulatory surface. Histograms on the left were derived from the 1 ng/ml MCC–I-Ek surfaces. (b) Immunoblot validation of PKC knockdown by siRNA. The proteins targeted by siRNA in each sample are listed above the blots, and the proteins detected by antibodies are listed to the left of the blots. NT = nontargeting siRNA control. All data are representative of at least two independent experiments.

Similar articles

Cited by

References

    1. Huse M, Quann EJ, Davis MM. Shouts, whispers, and the kiss of death: directional secretion in T cells. Nat Immunol. 2008;9:1105–1111. - PMC - PubMed
    1. Stinchcombe JC, Griffiths GM. Secretory mechanisms in cell-mediated cytotoxicity. Annual review of cell and developmental biology. 2007;23:495–517. - PubMed
    1. Chang JT, et al. Asymmetric T lymphocyte division in the initiation of adaptive immune responses. Science. 2007;315:1687–1691. - PubMed
    1. Combs J, et al. Recruitment of dynein to the Jurkat immunological synapse. Proc Natl Acad Sci U S A. 2006;103:14883–14888. - PMC - PubMed
    1. Martin-Cofreces NB, et al. MTOC translocation modulates IS formation and controls sustained T cell signaling. J Cell Biol. 2008;182:951–962. - PMC - PubMed

Publication types

MeSH terms