

Morphological analysis of activity-reduced adult-born neurons in the mouse olfactory bulb
- PMID: 21602912
- PMCID: PMC3092085
- DOI: 10.3389/fnins.2011.00066
Morphological analysis of activity-reduced adult-born neurons in the mouse olfactory bulb
Abstract
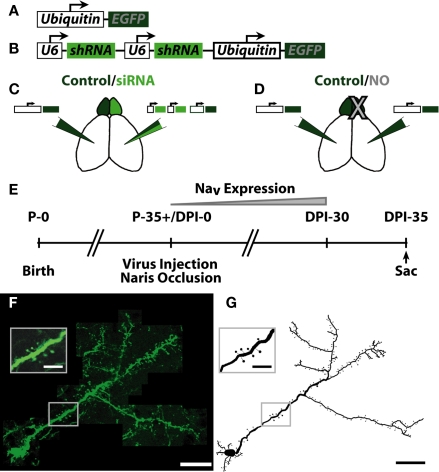
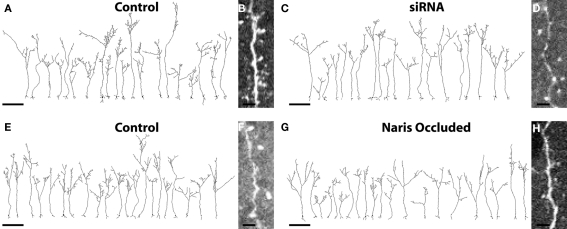
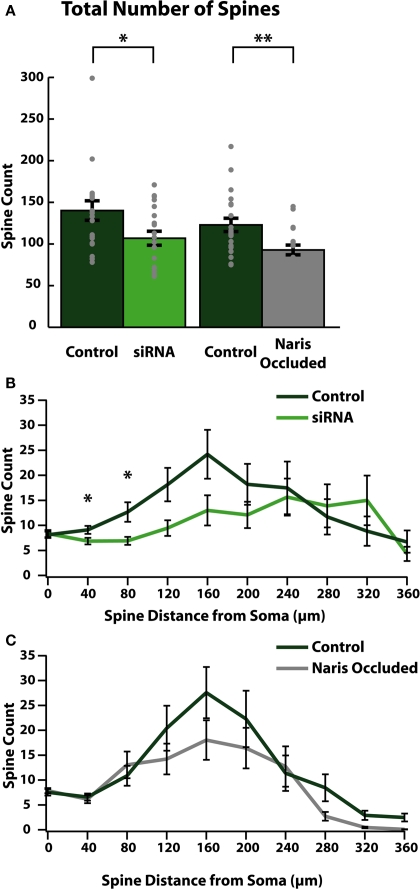
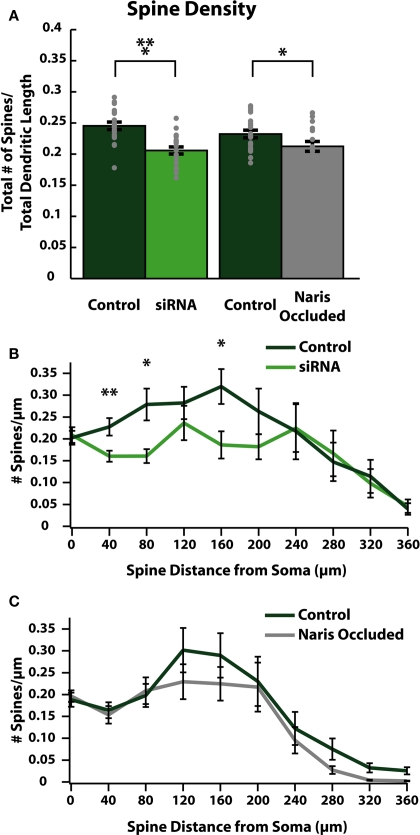
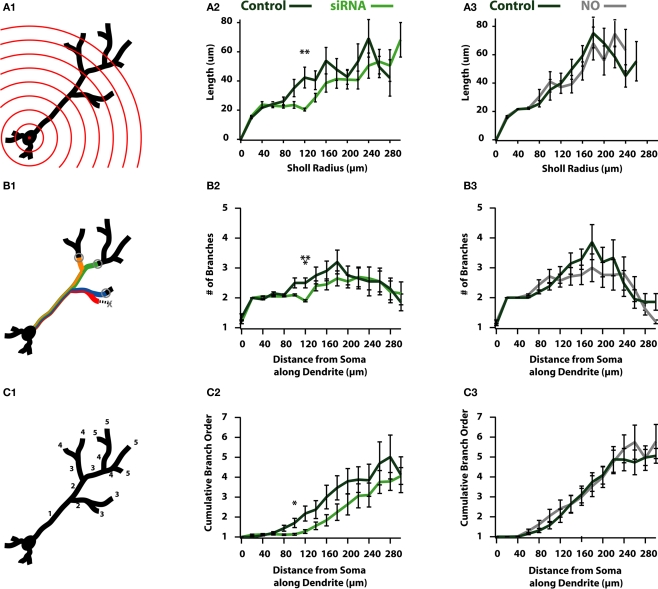
Adult-born neurons (ABNs) are added to the olfactory bulb (OB) throughout life in rodents. While many factors have been identified as regulating the survival and integration of ABNs into existing circuitry, the understanding of how these factors affect ABN morphology and connectivity is limited. Here we compare how cell intrinsic [small interfering RNA (siRNA) knock-down of voltage gated sodium channels Na(V)1.1-1.3] and circuit level (naris occlusion) reductions in activity affect ABN morphology during integration into the OB. We found that both manipulations reduce the number of dendritic spines (and thus likely the number of reciprocal synaptic connections) formed with the surrounding circuitry and inhibited dendritic ramification of ABNs. Further, we identified regions of ABN apical dendrites where the largest and most significant decreases occur following siRNA knock-down or naris occlusion. In siRNA knock-down cells, reduction of spines is observed in proximal regions of the apical dendrite. This suggests that distal regions of the dendrite may remain active independent of Na(V)1.1-1.3 channel expression, perhaps facilitated by activation of T-type calcium channels and NMDA receptors. By contrast, circuit level reduction of activity by naris occlusion resulted in a global depression of spine number. Together, these results indicate that ABNs retain the ability to develop their typical overall morphological features regardless of experienced activity, and activity modulates the number and location of formed connections.
Keywords: activity; morphology; naris occlusion; neurogenesis; olfaction; sodium channels.
Figures
Similar articles
-
BDNF over-expression increases olfactory bulb granule cell dendritic spine density in vivo.Neuroscience. 2015 Sep 24;304:146-60. doi: 10.1016/j.neuroscience.2015.07.056. Epub 2015 Jul 23. Neuroscience. 2015. PMID: 26211445 Free PMC article.
-
Functional Specialization of Interneuron Dendrites: Identification of Action Potential Initiation Zone in Axonless Olfactory Bulb Granule Cells.J Neurosci. 2019 Dec 4;39(49):9674-9688. doi: 10.1523/JNEUROSCI.1763-19.2019. Epub 2019 Oct 29. J Neurosci. 2019. PMID: 31662426 Free PMC article.
-
Coincidence Detection within the Excitable Rat Olfactory Bulb Granule Cell Spines.J Neurosci. 2019 Jan 23;39(4):584-595. doi: 10.1523/JNEUROSCI.1798-18.2018. J Neurosci. 2019. PMID: 30674614 Free PMC article.
-
Electrically coupled but chemically isolated synapses: dendritic spines and calcium in a rule for synaptic modification.Prog Neurobiol. 1988;31(6):507-28. doi: 10.1016/0301-0082(88)90013-5. Prog Neurobiol. 1988. PMID: 2849143 Review.
-
Zinc as a Neuromodulator in the Central Nervous System with a Focus on the Olfactory Bulb.Front Cell Neurosci. 2017 Sep 21;11:297. doi: 10.3389/fncel.2017.00297. eCollection 2017. Front Cell Neurosci. 2017. PMID: 29033788 Free PMC article. Review.
Cited by
-
The role of microglia and their CX3CR1 signaling in adult neurogenesis in the olfactory bulb.Elife. 2017 Dec 18;6:e30809. doi: 10.7554/eLife.30809. Elife. 2017. PMID: 29251592 Free PMC article.
-
BDNF over-expression increases olfactory bulb granule cell dendritic spine density in vivo.Neuroscience. 2015 Sep 24;304:146-60. doi: 10.1016/j.neuroscience.2015.07.056. Epub 2015 Jul 23. Neuroscience. 2015. PMID: 26211445 Free PMC article.
-
Endogenous but not sensory-driven activity controls migration, morphogenesis and survival of adult-born juxtaglomerular neurons in the mouse olfactory bulb.Cell Mol Life Sci. 2023 Mar 18;80(4):98. doi: 10.1007/s00018-023-04753-4. Cell Mol Life Sci. 2023. PMID: 36932186 Free PMC article.
-
Ion Channels in Odor Information Processing of Neural Circuits of the Vertebrate Olfactory Bulb.Int J Mol Sci. 2024 Dec 10;25(24):13259. doi: 10.3390/ijms252413259. Int J Mol Sci. 2024. PMID: 39769024 Free PMC article. Review.
-
Signaling mechanisms underlying activity-dependent integration of adult-born neurons in the mouse olfactory bulb.Genesis. 2024 Apr;62(2):e23595. doi: 10.1002/dvg.23595. Genesis. 2024. PMID: 38553878 Free PMC article. Review.
References
-
- Altman J. (1969). Autoradiographic and histological studies of postnatal neurogenesis. IV. Cell proliferation and migration in the anterior forebrain, with special reference to persisting neurogenesis in the olfactory bulb. J. Comp. Neurol. 137, 433–457 - PubMed
-
- Carleton A., Petreanu L. T., Lansford R., varez-Buylla A., Lledo P. M. (2003). Becoming a new neuron in the adult olfactory bulb. Nat. Neurosci. 6, 507–518 - PubMed
Grants and funding
LinkOut - more resources
Full Text Sources
Miscellaneous