

doi: 10.1371/journal.pone.0019541.
Epub 2011 May 13.
Gitools: analysis and visualisation of genomic data using interactive heat-maps
Affiliations
- PMID: 21602921
- PMCID: PMC3094337
- DOI: 10.1371/journal.pone.0019541
Item in Clipboard
Gitools: analysis and visualisation of genomic data using interactive heat-maps
PLoS One.
2011.
Abstract
Intuitive visualization of data and results is very important in genomics, especially when many conditions are to be analyzed and compared. Heat-maps have proven very useful for the representation of biological data. Here we present Gitools (http://www.gitools.org), an open-source tool to perform analyses and visualize data and results as interactive heat-maps. Gitools contains data import systems from several sources (i.e. IntOGen, Biomart, KEGG, Gene Ontology), which facilitate the integration of novel data with previous knowledge.
Conflict of interest statement
Figures
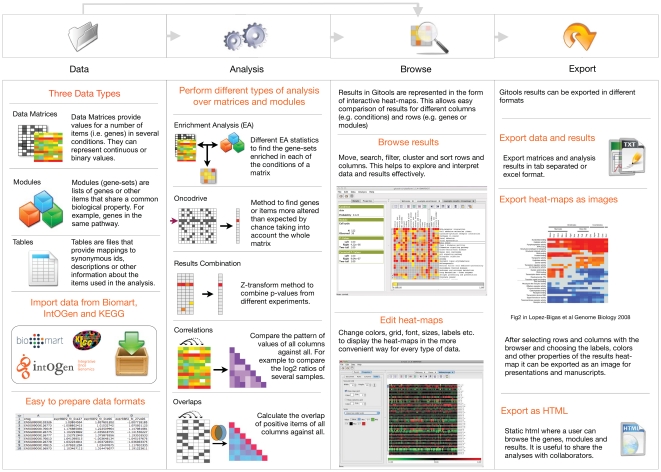
In the first step the data to be analyzed or visualized is prepared. This can be done by opening files that have been prepared externally or by importing the data from IntOGen, Biomart, Gene Ontology or KEGG databases. In the second step the user chooses which analysis to perform: enrichment, oncodrive, combination of p-values, correlations and overlaps. The parameters for the analysis are prompted using graphical wizards. In the third step the results are browsed and arranged in order to retrieve relevant information. In the fourth step the results are exported to tables, images and html.
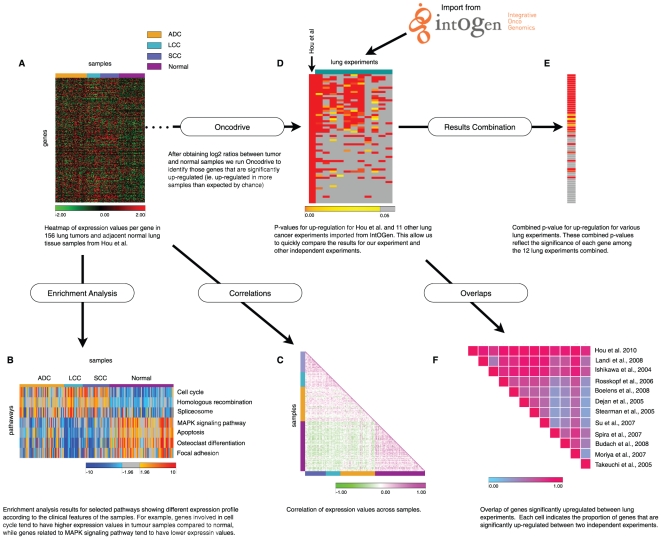
A. Expression matrix of a subset of probes for 156 samples classified as Squamous cell carcinoma (SCC), adenocarcinoma (ADC), large cell carcinoma (LCC) and adjacent normal lung tissue samples (normal) from Hou et al . B. Heat-map of z-scores per pathway and sample resulting from an enrichment analysis using KEGG pathways as modules (only a selected subset of KEGG pathways are shown). C. Correlation of expression values per sample. D. Heat-map of p-values per gene indicating significant up-regulation for Hou et al experiment and 11 other lung tumor experiments imported from IntOGen. The heat-map shows the top significant genes in Hou et al experiment. E. One column heat-map depicting the combined p-value for up-regulation considering the 12 lung cancer experiments for the top significant genes in Hou et al. F. Result of the overlap analysis of genes significantly up-regulated in Hou et al and the other 11 lung cancer experiments from IntOGen.
References
-
- Gundem G, Perez-Llamas C, Jene-Sanz A, Kedzierska A, Islam A, et al. IntOGen: integration and data mining of multidimensional oncogenomic data. Nat Meth. 2010;7:92–93. - PubMed
-
- Saeed AI, Sharov V, White J, Li J, Liang W, et al. TM4: a free, open-source system for microarray data management and analysis. BioTechniques. 2003;34:374–378. - PubMed
-
- Reich M, Liefeld T, Gould J, Lerner J, Tamayo P, et al. GenePattern 2.0. Nat Genet. 2006;38:500–501. - PubMed
Publication types
MeSH terms
LinkOut - more resources
Full Text Sources
Other Literature Sources
Molecular Biology Databases
