. 2011;6(5):e19506.
doi: 10.1371/journal.pone.0019506. Epub 2011 May 13.

CD133 positive embryonal rhabdomyosarcoma stem-like cell population is enriched in rhabdospheres

Affiliations

CD133 positive embryonal rhabdomyosarcoma stem-like cell population is enriched in rhabdospheres

Dagmar Walter et al. PLoS One. 2011.

Abstract

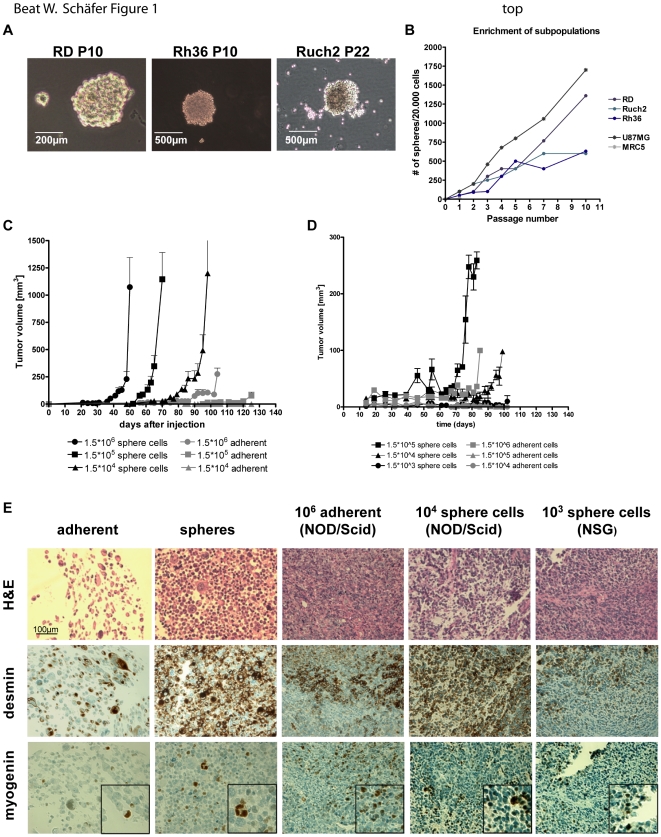
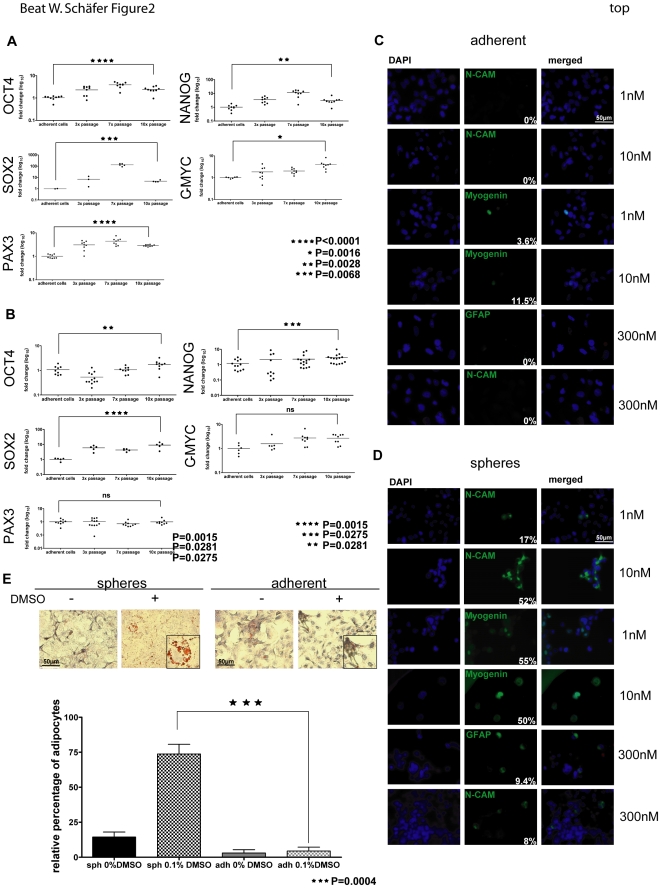
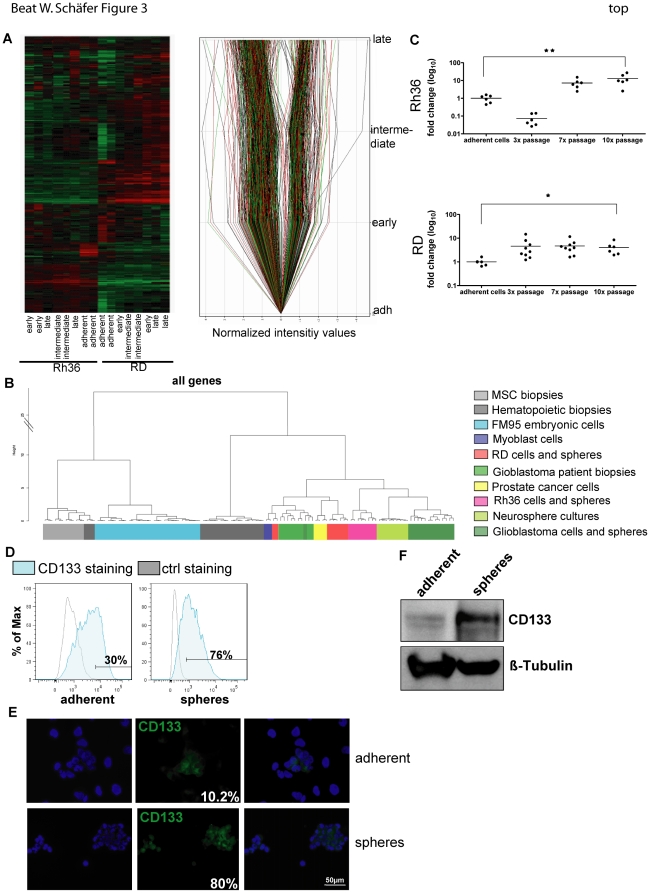
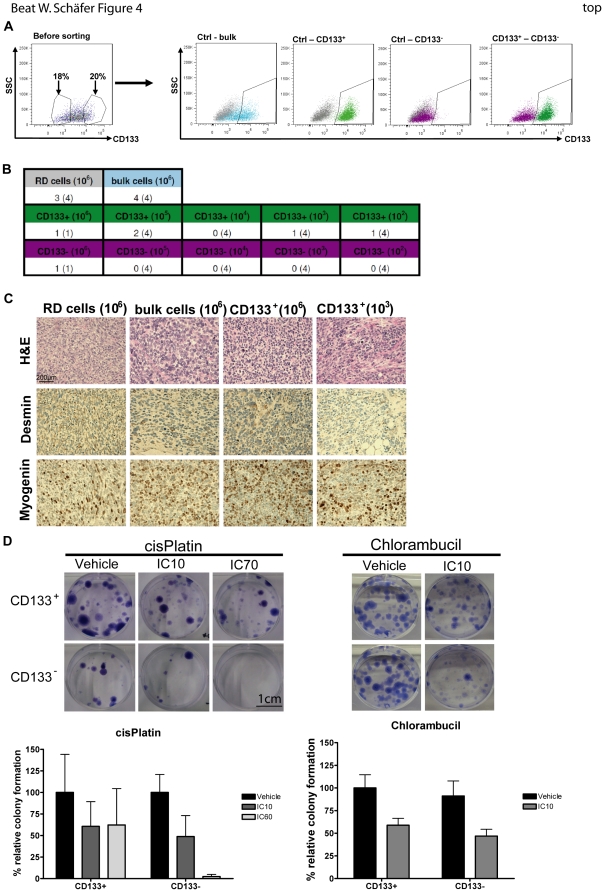
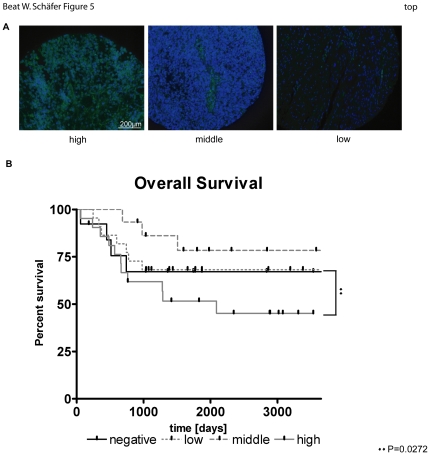
Cancer stem cells (CSCs) have been identified in a number of solid tumors, but not yet in rhabdomyosarcoma (RMS), the most frequently occurring soft tissue tumor in childhood. Hence, the aim of this study was to identify and characterize a CSC population in RMS using a functional approach. We found that embryonal rhabdomyosarcoma (eRMS) cell lines can form rhabdomyosarcoma spheres (short rhabdospheres) in stem cell medium containing defined growth factors over several passages. Using an orthotopic xenograft model, we demonstrate that a 100 fold less sphere cells result in faster tumor growth compared to the adherent population suggesting that CSCs were enriched in the sphere population. Furthermore, stem cell genes such as oct4, nanog, c-myc, pax3 and sox2 are significantly upregulated in rhabdospheres which can be differentiated into multiple lineages such as adipocytes, myocytes and neuronal cells. Surprisingly, gene expression profiles indicate that rhabdospheres show more similarities with neuronal than with hematopoietic or mesenchymal stem cells. Analysis of these profiles identified the known CSC marker CD133 as one of the genes upregulated in rhabdospheres, both on RNA and protein levels. CD133(+) sorted cells were subsequently shown to be more tumorigenic and more resistant to commonly used chemotherapeutics. Using a tissue microarray (TMA) of eRMS patients, we found that high expression of CD133 correlates with poor overall survival. Hence, CD133 could be a prognostic marker for eRMS. These experiments indicate that a CD133(+) CSC population can be enriched from eRMS which might help to develop novel targeted therapies against this pediatric tumor.


Conflict of interest statement

Competing Interests: The authors have declared that no competing interests exist.

Figures

Figure 1
Figure 1. Cancer stem-like cells are enriched in Rhabdospheres.
A), B) Embryonal rhabdomyosarcoma (eRMS) cell lines (RD, Rh36 and Ruch2) were cultured in stem cell medium (SC-medium) over several passages. A glioblastoma (U87MG) and a fibroblast (MRC5) cell line were used as controls. A) Representative phase contrast pictures of cultured RD, Ruch2 and Rh36 sphere cultures (400× magnification). B) Subpopulation enrichment over several passages (x-axis) was estimated by counting the obtained spheres per cell (y-axis). C), D) Limited dilution (106, 105 and 104) of adherent versus sphere cells in vivo. Cells were intramuscularly (i.m.) injected into NOD/Scid (n = 6) (C) and NSG mice (n = 3) (D) at the indicated numbers and tumor growth (y-axis; tumor volume in mm3) was measured over time (x-axis). E) Immunohistochemical (IHC) stainings of xenograft tumor sections on a xenograft tissue microarray (TMA). Adherent and sphere cells were used as controls on the TMA. The TMA was stained for H&E and RMS markers (desmin and myogenin). Representative IHC stainings are shown (400× magnification). The small inserts represent magnifications of positively stained cells.
Figure 2
Figure 2. Sphere cultures have stem cell characteristics.
A), B) Expression analysis of stem cell genes (oct4, nanog, sox2, c-myc and pax3) by Real-time PCR. RD (A) and Rh36 (B) adherent cells and 3 different sphere culture passages (3×, 7×, 10×) were compared. C), D) RD cells (C) and their corresponding sphere cultures (D) were treated with retinoic acid (1nM, 10nM, 300nM) for 24 days and stained for differentiation markers (N-CAM, myogenin and GFAP). Percentage of positivity was calculated by counting 3 different random microscopic fields with at least 30 cells. E) RD cells and spheres were treated with 0.1% DMSO for 3 days. After additional 8 days, cells were stained for OilRedO. Percentage of cells with fatty vacuoles was calculated by counting 4 independent slides. Representative pictures and magnifications (small box) of OilRedO stainings are shown. For A) ★★★★ P<0.0001; ★★ P = 0.0028; ★ P = 0.0016; ★★★ P = 0.0068. For B) ★★★★ P = 0.0015; ★★ P = 0.0281; ★★★ P = 0.0275. For E) ★★★ P = 0.0004. Abbreviations: ns, not significant; GFAP, glial fibrillary acidic protein; N-CAM, neural cell adhesion molecule; sph, spheres; adh, adherent; DMSO, dimethylsulfoxid.
Figure 3
Figure 3. CD133 is upregulated in sphere cultures.
Gene expression profiling (HuEx-1_0-st-v2) of two eRMS cells (RD and Rh36) and spheres (early, middle and late). A) left side: Cluster plot of RD and Rh36 cells and spheres. Right side: Analysis of RD samples. Genes, being up- or downregulated in RD spheres with a fold change of at least 2, are shown. B) Correlation plot of a metaanalysis performed with different publicly available expression data (hematopoietic and mesenchymal stem cells biopsies, FM95 cells, embryonic skeletal myoblast cells, embryonic stem cells, neuronal cells, glioblastoma spheres, cells and patient samples, neurospheres and prostate cancer samples) as indicated C) Expression of CD133 mRNA quantified by real-time PCR after correction with GAPDH levels as house-keeping gene. D) Flow cytometry analysis of CD133 (blue) expression. As controls unstained adherent and sphere cells were used, respectively (grey). E) Immunofluorescence staining of CD133 (green) of adherent and sphere cells. The nuclei were counterstained with DAPI (blue). Fields of two independent slides with at least 50 cells each were counted and the percentage of positive stained cells calculated. F) Western blot analysis of CD133 protein expression in adherent and sphere cells. ß-Tubulin was used as a loading control. A representative blot is shown. For C) ★ P = 0.0284; ★★ P = 0.0079. Abbreviations: ctrl, control; MSC, mesenchymal stem cells.
Figure 4
Figure 4. CD133+ RMS cells are more chemoresistant and tumorigenic.
A) RD cells were stained for CD133 (blue) and sorted into CD133+ (green) and CD133 (violet) populations with a MoFlo high speed cell sorter (DakoCytomation). Unstained RD cells were used as control (grey). After sorting the different fractions were reanalyzed by flow cytometry. B) Limited dilutions in vivo of different subpopulations (106, 105, 104, 103and 102). Bulk stained (106) and unstained cells without sorting (106) were used as controls. Cells were injected i.m. into NOD/Scid mice (n = 4) and tumor growth measured. Numbers indicate mice with growing tumors. C) Immunohistochemical (IHC) analysis of all xenograft tumors (H&E, Myogenin and Desmin). Representative stainings are shown. D) Clonogenic assay with sorted subpopulations (CD133+ and CD133). Cells were treated with cisPlatin (IC10 = 10 µM and IC60 = 50 µM) and Chlorambucil (IC10 = 6.45 µM). Colonies were visualized by crystal violet. cisPlatin: mean of 3 independent sortings ± SEM; Chlorambucil: mean of 2 independent sortings ± SEM. For D) ★★ P = 0.0377; ★ P = 0.0241. Abbreviations: IC, inhibitory concentration; ctrl, control.
Figure 5
Figure 5. High expression of CD133 correlates with a poor survival rate.
Immunofluorescence staining of a human RMS TMA with CD133 (green). Nuclei were counterstained with DAPI (blue). Two values were chosen for scoring: Staining intensity (1 = low, 2 = middle and 3 = bright) and number of positive cells (0 = 0; 1 = 1–10; 2 = 11–20; 3≥21). Both values were added up to the scorings negative (0 and 1), low (2 and 3), middle (4) and high (5 and 6). A) Stainings of representative tumor sections are shown for high, middle and low scorings. B) Overall survival of eRMS patients as shown by a Kaplan-Meier curve. For A) ★★ P = 0.0272.

References

    1. Lobo NA, Shimono Y, Qian D, Clarke MF. The biology of cancer stem cells. Annu Rev Cell Dev Biol. 2007;23:675–699. - PubMed
    1. Bonnet D, Dick JE. Human acute myeloid leukemia is organized as a hierarchy that originates from a primitive hematopoietic cell. Nat Med. 1997;3:730–737. - PubMed
    1. Al-Hajj M, Wicha MS, Benito-Hernandez A, Morrison SJ, Clarke MF. Prospective identification of tumorigenic breast cancer cells. Proc Natl Acad Sci U S A. 2003;100:3983–3988. - PMC - PubMed
    1. Singh S, Dirks PB. Brain tumor stem cells: identification and concepts. Neurosurg Clin N Am. 2007;18:31–38, viii. - PubMed
    1. Todaro M, Francipane MG, Medema JP, Stassi G. Colon cancer stem cells: promise of targeted therapy. Gastroenterology. 2010;138:2151–2162. - PubMed

Publication types

MeSH terms