. 2011 Apr 21;115(15):7298-7308.
doi: 10.1021/jp112255j.

Ensemble and Single Molecule Studies on the Use of Metallic Nanostructures to Enhance the Intrinsic Emission of Enzyme Cofactors

Affiliations

Ensemble and Single Molecule Studies on the Use of Metallic Nanostructures to Enhance the Intrinsic Emission of Enzyme Cofactors

Mustafa H Chowdhury et al. J Phys Chem C Nanomater Interfaces. .

Abstract

We present a strategy for enhancing the intrinsic emission of the enzyme cofactors flavin adenine dinucleotide (FAD), flavin mononucleotide (FMN) and nicotinamide adenine dinucleotide (NADH). Ensemble studies show that silver island films (SIFs) are the optimal metal enhanced fluorescence (MEF) substrates for flavins and gave emission enhancements of over 10-fold for both FAD and FMN. A reduction in the lifetime of FAD and FMN on SIFs was also observed. Thermally evaporated aluminum films on quartz slides were found to be the optimal MEF substrate for NADH and gave a 5-fold increase in the emission intensity of NADH. We present finite-difference time-domain (FDTD) calculations that compute the enhancement in the radiated power emitting from an excited state dipole emitting in the wavelength range of NADH in close proximity to an aluminum nanoparticle, and a dipole emitting in the emission wavelength of flavins next to a silver nanoparticle. These calculations confirm that aluminum serves as the optimal MEF substrate for NADH and silver was the optimal MEF substrate for flavins. This is because the plasmon resonance properties of aluminum lie in the UV-blue regime and that of silver lie in the visible region. We also present the results of single molecule studies on FMN which show SIFs can both significantly enhance the intrinsic emission from single FMN molecules, significantly reduce their lifetimes and also significantly reduce FMN blinking. This is the first report of the observation of MEF from cofactors both at the ensemble and single molecule level. We hope this study will serve as a platform to encourage the future use of metallic nanostructures to study cofactors using their intrinsic fluorescence to directly monitor enzyme binding reactions without the need of extrinsic labeling of the molecules.


Figures

Figure 1
Figure 1
(a) Normalized absorption and emission spectra in water of NADH; (b) Normalized absorption and emission spectra in water of FAD; (c) Normalized absorption and emission spectra in water of FMN.
Figure 2
Figure 2
(a) FE-SEM image of SIFs; (b) Extinction spectra of SIFs; (c) SEM image of 10 nm thick Al film; (d) Extinction spectra of 10 nm thick Al film.
Figure 3
Figure 3
(a) Fluorescence emission spectra of NADH on 10 nm Al film and quartz; (b) Fluorescence emission spectra of FAD on SIFs and glass; (c) Intensity decay of FAD on glass and SIFs substrate showing a shorter lifetime of the FAD on SIFs than on glass. IRF is the instrument response function.
Figure 4
Figure 4
(a) Fluorescence emission spectra of FMN on SIFs and glass; (b) Intensity decay of FMN on glass and on a SIFs substrate showing a shorter lifetime of the FMN on SIFs than the glass. IRF is the instrument response function; (c) Photostability of FMN on glass and SIFs substrates.
Figure 5
Figure 5
FDTD calculations showing: (a) the normalized scattering cross-section of an 80 nm aluminum and silver nanoparticle respectively; (b) the radiative power enhancement of a dipole next to an 80 nm aluminum nanoparticle in water with dipole-metal distances of 5 nm and 10 nm; (b) the radiative power enhancement of a dipole next to an 80 nm silver nanoparticle in water with dipole-metal distances of 5 nm and 10 nm. In both figures the dipole is oriented perpendicular to the metal surface.
Figure 6
Figure 6
(a) Near-field intensities arising from an isolated point dipole radiating at λ = 530 nm; (b) Near-field enhancement around an 80 nm diameter silver nanoparticle due to the interaction with a 530 nm emitting dipole located 5 nm from the surface; (c) Near-field enhancement around an 80 nm diameter aluminum nanoparticle due to the interaction with a 530 nm emitting dipole located 5 nm from the surface. Images are on a log scale (base 10), and the dipole is oscillating along the x-axis, which corresponds to the perpendicular orientation described in the text.
Figure 7
Figure 7
(a) FDTD calculations of the near-field intensity enhancement image in water of the fields created around a 80 nm silver nanoparticle by its interaction with the plane wave of wavelength λ = 340 nm; (b): Near-field intensity enhancement image in water of the fields created around a 80 nm aluminum nanoparticle by its interaction with the plane wave of wavelength λ = 340 nm; (c) Near-field intensity enhancement image in water of the fields created around an 80 nm silver nanoparticle by its interaction with the plane wave of wavelength λ = 440 nm; (d) Near-field intensity enhancement image in water of the fields created around an 80 nm aluminum nanoparticle by its interaction with the plane wave of wavelength λ = 440 nm. For all the cases the plane wave is oriented along the x-axis and propagating along the z-axis (out of the plane of paper). Note all images are in the log scale (base 10).
Figure 8
Figure 8
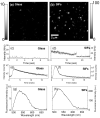
Scanning confocal images of FMN molecules on (a) Glass and (b) SIFs. Scale bar shows the intensity counts in 1-ms bin; Intensity-time trajectories of individual FMN molecules on (c) SIFs and (d) Glass; Fluorescence intensity decays of individual FMN molecules on (e) glass and (f) SIFs surfaces; Single-molecule fluorescence spectra of individual FMN molecules: (g) on glass and; (h) SIFs surfaces.
Figure 9
Figure 9
Fluorescence intensity histograms of FMN on (a) glass and (b) SIFs. Average fluorescence lifetime histogram of FMN on (c) glass and (d) SIFs surface.

Similar articles

Cited by

References

    1. Lakowicz JR. Principles of Fluorescence Spectroscopy. 3rd Ed Springer; New York: 2006.
    1. Rigler R, Edman L, Földes-Papp Z, Wennmalm S. Fluorescence Correlation Spectroscopy in Single-Molecule Analysis: Enzymatic Catalysis at the Single Molecule Level. In: Rigler R, Orrit M, Basché T, editors. Single Molecule Spectroscopy - Nobel Conference Lectures. Springer; New York: 2001. p. 177.
    1. Visser AJWG, van den Berg PAW, Hink MA, Petushkov VN. Fluorescence Correlation Spectroscopy of Flavins and Flavoproteins. In: Rigler R, Elson ES, editors. Fluorescence Correlation Spectroscopy – Theory and Applications. Springer; New York: 2002. p. 9.
    1. van den Berg PAW, Visser AJWG. Tracking Molecular Dynamics of Flavoproteins with Time-Resolved Fluorescence Spectroscopy. In: Valeur B, Brochon B-V, editors. New Trends in Fluorescence Spectroscopy – Applications to Chemical and Life Sciences. Springer; New York: 2001. p. 457.
    1. van den Berg PAW, Widengren J, Hink MA, Rigler R, Visser AJWG. Spectrochim. Acta A. 2001;57:2135. - PubMed

LinkOut - more resources