. 2011 Jan 18;24(2):45-78.
doi: 10.4054/DemRes.2011.24.2.

Out of sync? Demographic and other social science research on health conditions in developing countries

Affiliations

Out of sync? Demographic and other social science research on health conditions in developing countries

Jere R Behrman et al. Demogr Res. .

Abstract

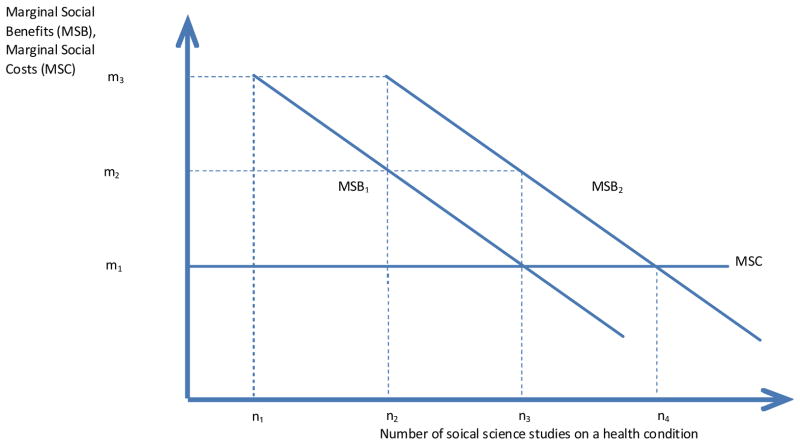
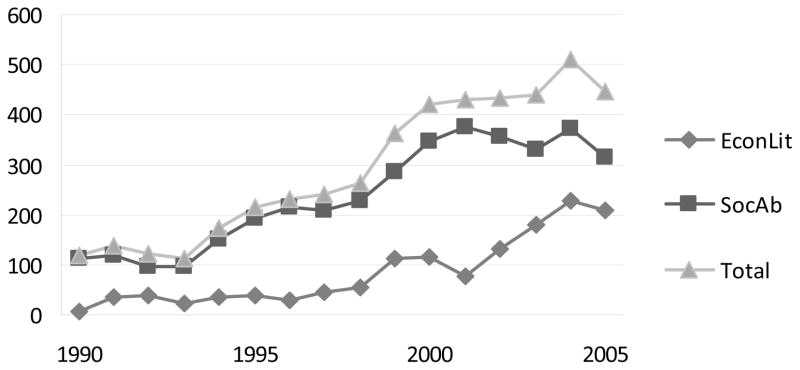
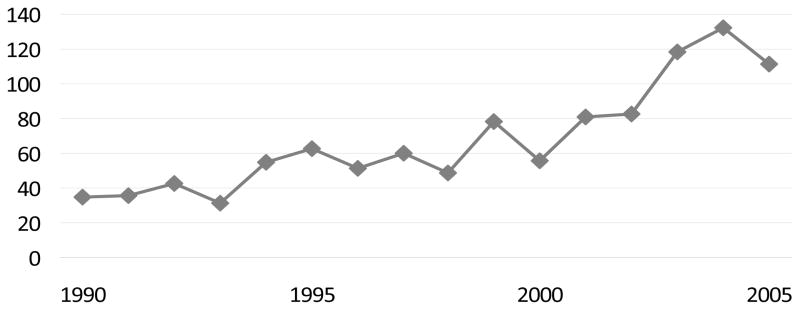
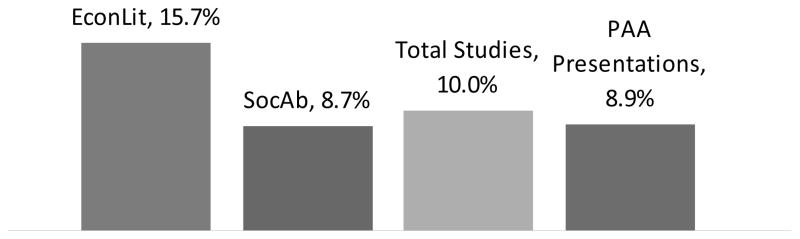
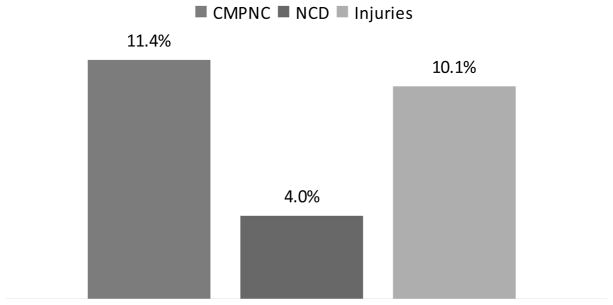
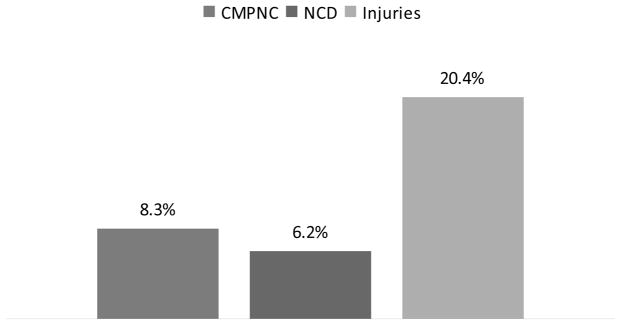
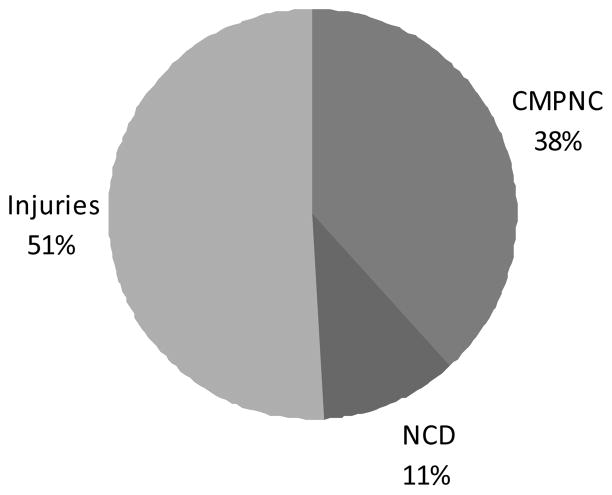
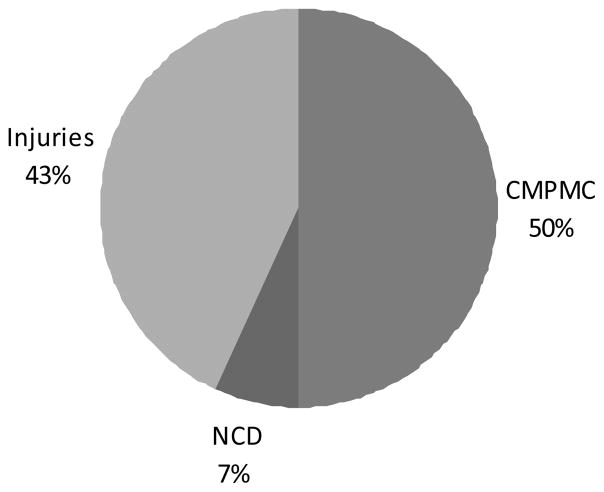
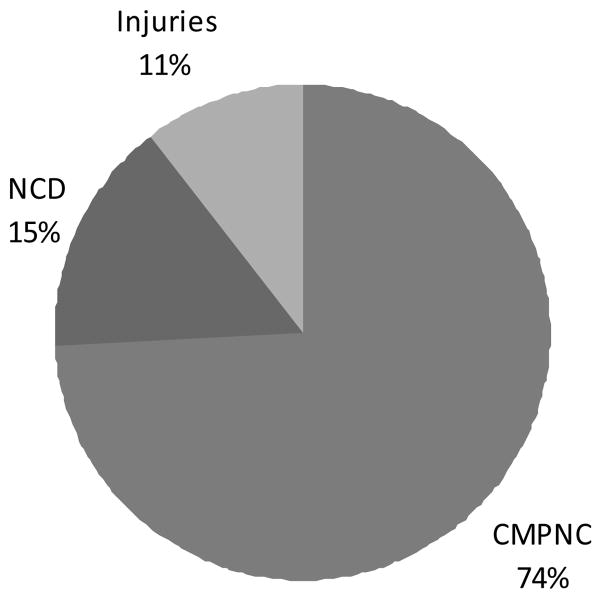
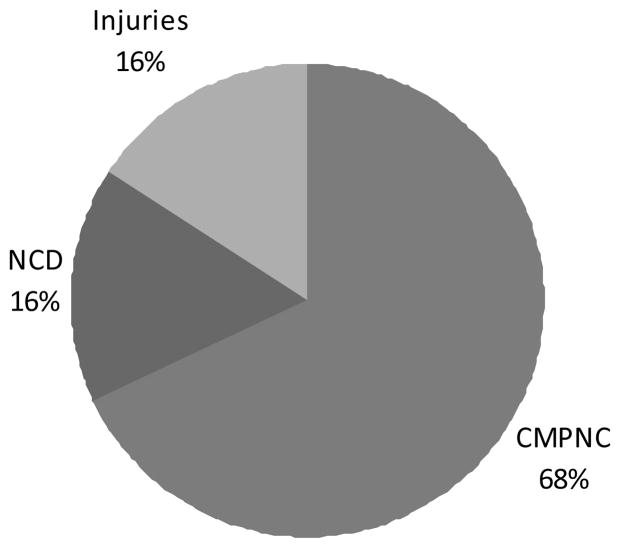
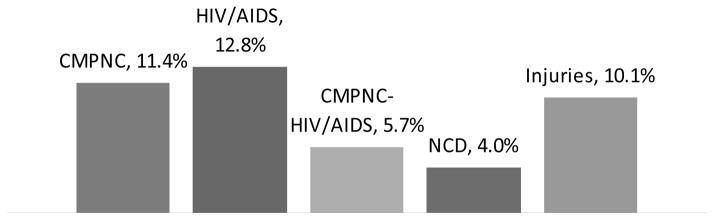
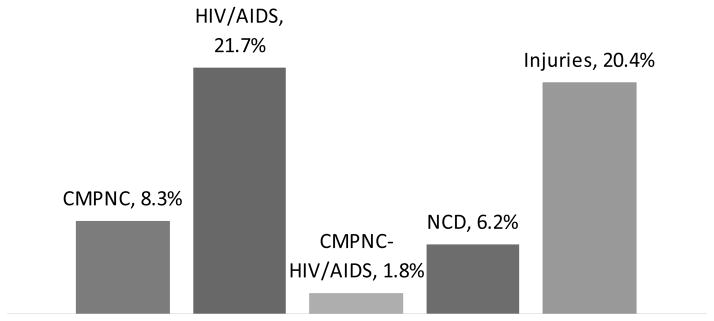
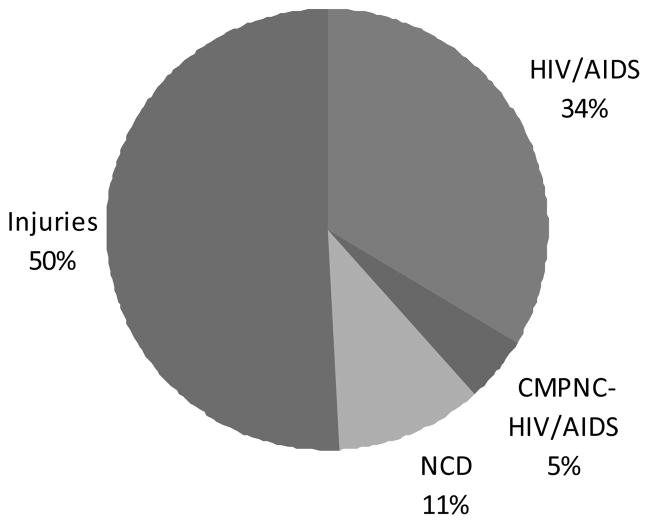
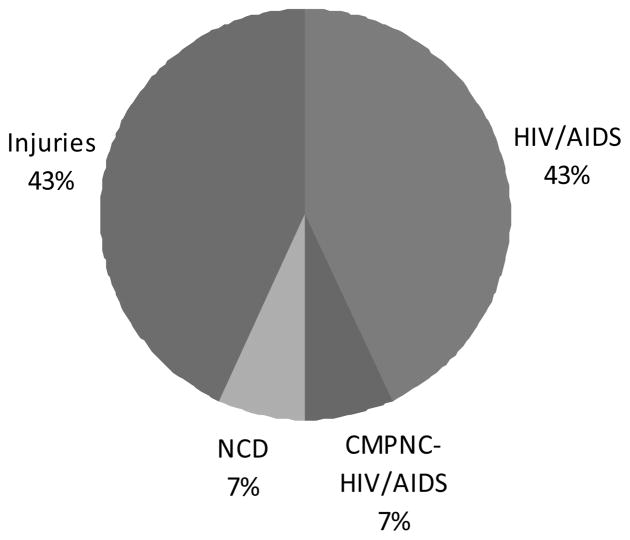
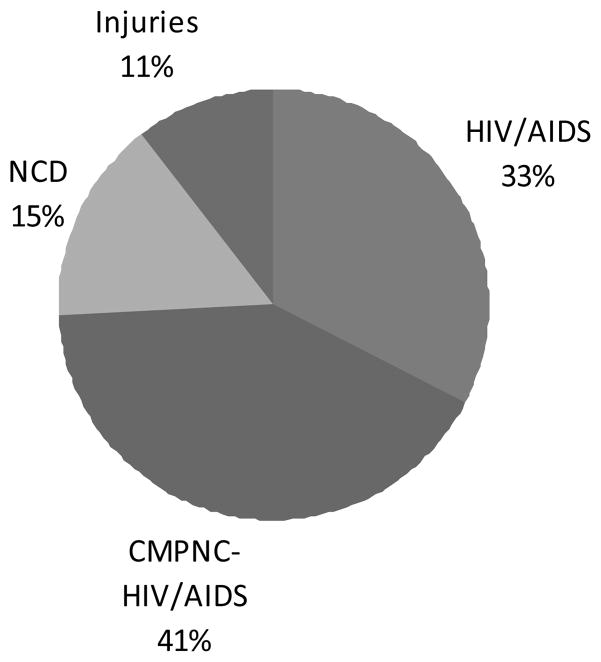
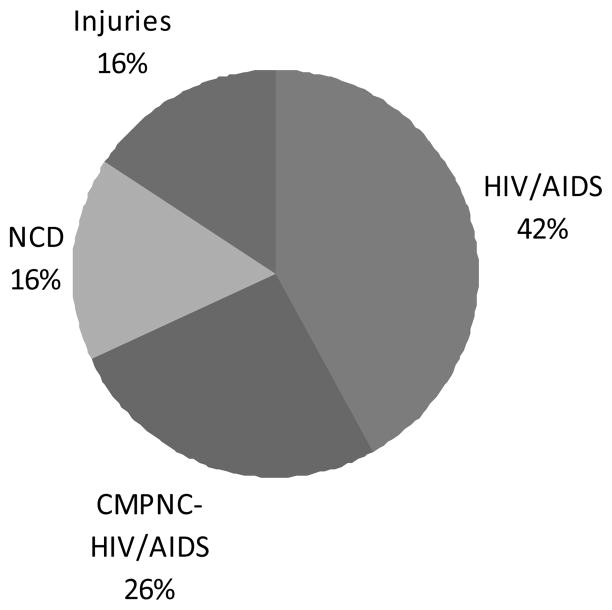
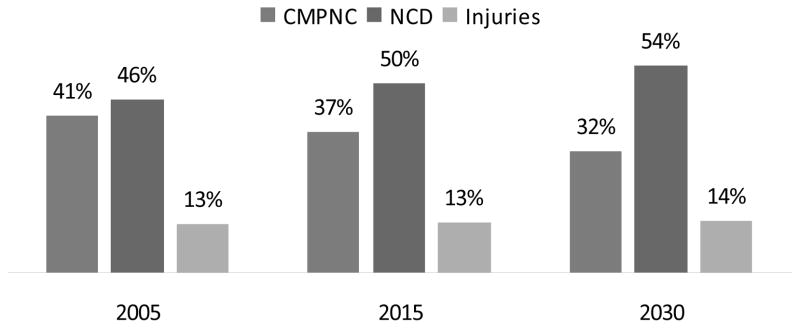
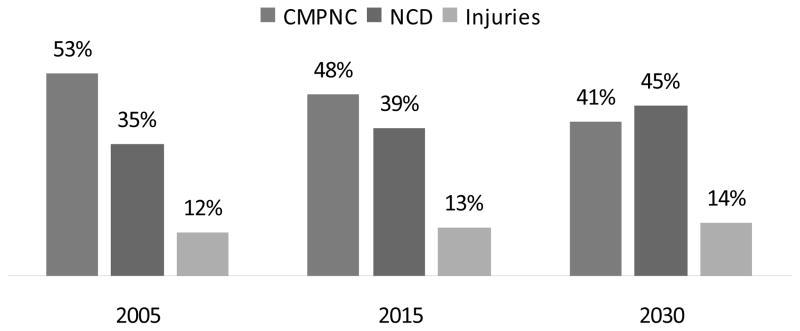
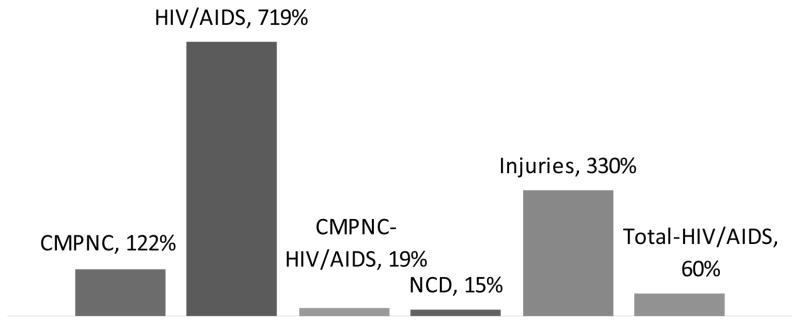
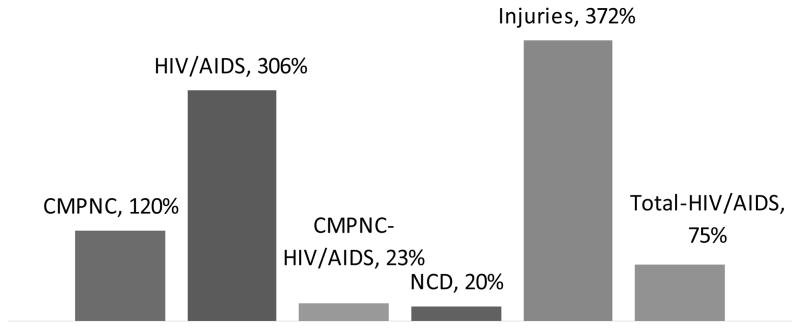
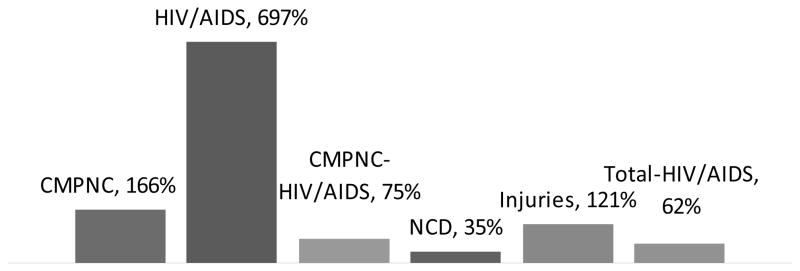
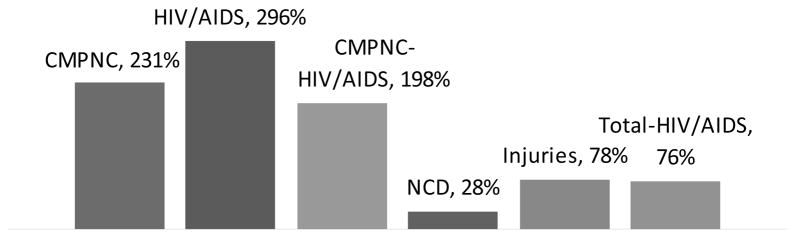
In this paper, we present a framework for considering whether the marginal social benefits of demographic and social science research on various health conditions in developing countries are likely to be relatively high. Based on this framework, we argue that the relative current and future predicted prevalence of burdens of different health/disease conditions, as measured by disability-adjusted life years (DALYs), provide a fairly accurate reflection of some important factors related to the relative marginal social benefits of demographic and social science research on different health conditions. World Health Organization (WHO) DALYs projections for 2005-30 are compared with (a) demographic and other social science studies on health in developing countries during 1990-2005, and (b) presentations made at the Population Association of America annual meetings during the same time period. These comparisons suggest that recent demographic and social science research on health in developing countries has focused too much on HIV/AIDS, and too little on non-communicable diseases.


Figures

Figure 1
Figure 1
Marginal social benefits of social science research on any health condition (MSB) and marginal social costs for social science research on any health condition (MSC)
Chart 1A
Chart 1A
Studies on health in developing countries, 1990–2005
Chart 1B
Chart 1B
PAA presentations related to health in developing countries, 1990–2005
Chart 1C
Chart 1C
Average annual exponential growth rates between 1990–2 and 2003–5 in studies and PAA presentations related to health and development
Chart 2A
Chart 2A
Average annual exponential growth rates for 1990–2 to 2003–5 in studies by three major GBD/WHO categories
Chart 2B
Chart 2B
Average annual exponential growth rates from 1990–2 to 2003–5 in PAA presentations by three major GBD/WHO categories
Chart 3A
Chart 3A
Composition of studies for 1990–2005 by three major GBD/WHO categories
Chart 3B
Chart 3B
Composition of studies for 2003–5 by three major GBD/WHO categories
Chart 3C
Chart 3C
Composition of PAA presentations for 1990–2005 by three major GBD/WHO categories
Chart 3D
Chart 3D
Composition of PAA presentations for 2003–5 by three major GBD/WHO categories
Chart 4A
Chart 4A
Average exponential growth rates in studies between 1990–2 and 2003–5 for three major GBD/WHO categories with HIV/AIDS separate
Chart 4B
Chart 4B
Average annual exponential growth rates in PAA presentations between 1990–2 and 2003–5 for three major GBD/WHO categories with HIV/AIDS separate
Chart 5A
Chart 5A
Distribution of studies in 1990–2005 for three major GBD/WHO categories, with HIV/AIDS separate
Chart 5B
Chart 5B
Distribution of studies in 2003–5 for three major GBD/WHO categories, with HIV/AIDS separate
Chart 5C
Chart 5C
Distribution of PAA presentations in 1990–2005 for three major GBD/WHO categories with HIV/AIDS separate
Chart 5D
Chart 5D
Distribution of PAA presentations in 2003–5 for three major GBD/WHO categories, with HIV/AIDS separate
Chart 6A
Chart 6A
% composition of DALYs projected for three major GBD/WHO categories for all developing countries CMPNC NCD Injuries
Chart 6B
Chart 6B
% composition of DALYs projected for three major GBD/WHO categories for low-income developing countries
Chart 7A
Chart 7A
% ratio of share in studies in 2003–5 to share in DALYs for 2005 for three major GBD/WHO categories, with HIV/AIDS separate (100% = average)
Chart 7B
Chart 7B
% ratio of share in studies in 1990–2005 to share in DALYs for 2030 for three major GBD/WHO categories, with HIV/AIDS separate (100% = average)
Chart 7C
Chart 7C
% ratio of share of PAA presentations in 2003–5 to share in DALYs for 2030 for three major GBD/WHO categories, with HIV/AIDS separate (100% = average)
Chart 7D
Chart 7D
% ratio of share of PAA presentations in 1990–2005 to share in DALYs for 2030 for three major GBD/WHO categories, with HIV/AIDS separate (100% = average)

References

    1. Asiimwe A, Rwiyereka AK, Kaufman JA, Shepard DS. AIDS Funds: Rwanda. Science. 2010 October;330:176. doi: 10.1126/science.330.6001.176-a. - DOI - PubMed
    1. Barry D, Townsend M. AIDS Funds: Promised. Science. 2010 October;330:174. doi: 10.1126/science.330.6001.174-a. - DOI - PubMed
    1. Bongaarts J, Over M. Global HIV/AIDS Policy in Transition. Science. 2010a June;328:1359–1360. doi: 10.1126/science.1191804. - DOI - PubMed
    1. Bongaarts J, Over M. Response. Science. 2010b October;330:177–178. doi: 10.1126/science.330.6001.177. - DOI
    2. Copenhagen Consensus. 2008.
    1. Copenhagen Consensus 2008 – Results. http://www.copenhagenconsensus.com.

LinkOut - more resources