. 2011:2011:265417.
doi: 10.1155/2011/265417. Epub 2011 Apr 28.

Differential effects of calorie restriction and exercise on the adipose transcriptome in diet-induced obese mice

Affiliations

Differential effects of calorie restriction and exercise on the adipose transcriptome in diet-induced obese mice

Karrie E Wheatley et al. J Obes. 2011.

Abstract

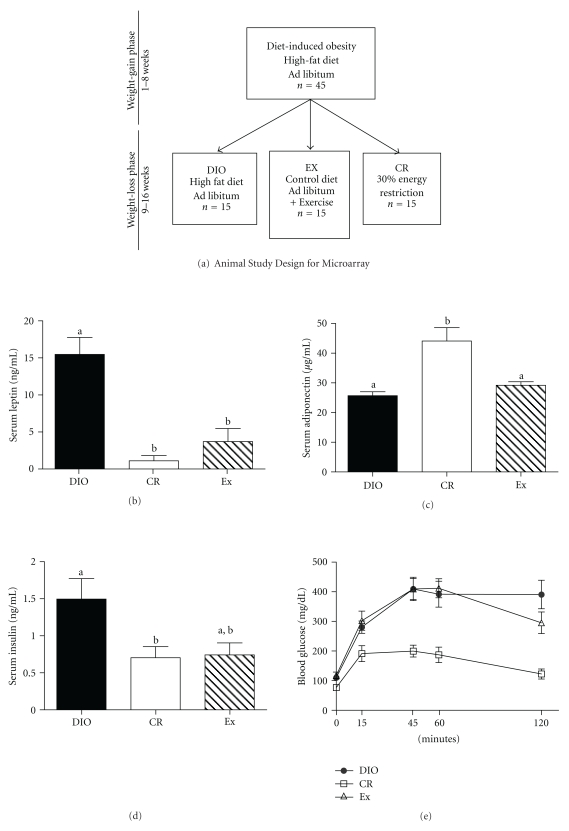
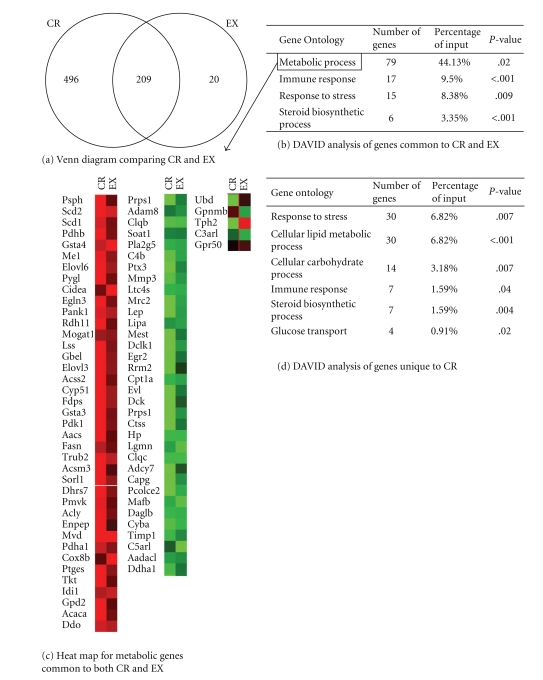
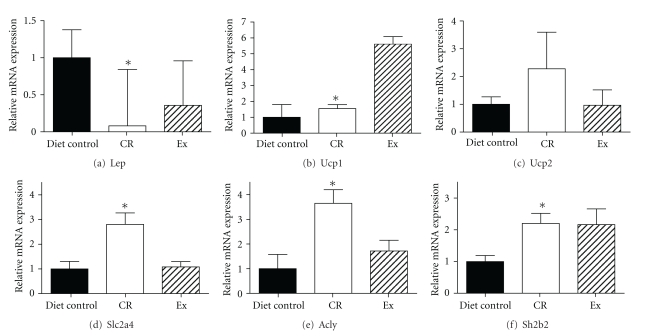
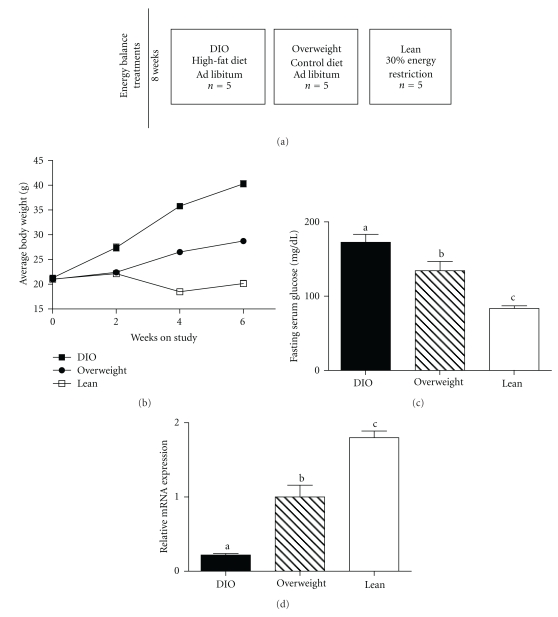
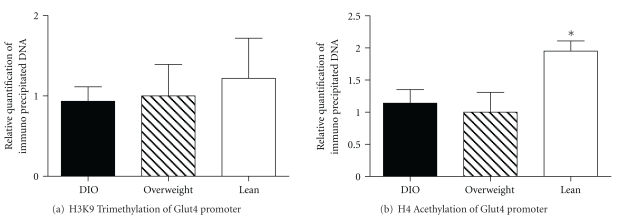
We tested the hypothesis that obesity reversal by calorie restriction (CR) versus treadmill exercise (EX) differentially modulates adipose gene expression using 48 female C57BL/6 mice administered a diet-induced obesity (DIO) regimen for 8 weeks, then randomized to receive for 8 weeks either: (1) a control (AIN-76A) diet, fed ad libitum (DIO control); (2) a 30% CR regimen; (3) a treadmill EX regimen (with AIN-76A diet fed ad libitum); or (4) continuation of the DIO diet. Relative to the DIO controls, both CR and EX reduced adiposity by 35-40% and serum leptin levels by 80%, but only CR increased adiponectin and insulin sensitivity. Gene expression microarray analysis of visceral white adipose tissue revealed 209 genes responsive to both CR and EX, relative to the DIO group. However, CR uniquely altered expression of an additional 496 genes, whereas only 20 were uniquely affected by EX. Of the genes distinctly responsive to CR, 17 related to carbohydrate metabolism and glucose transport, including glucose transporter (GLUT) 4. Chromatin immunoprecipitation assays of the Glut4 promoter revealed that, relative to the DIO controls, CR significantly increased histone 4 acetylation, suggesting epigenetic regulation may underlie some of the differential effects of CR versus EX on the adipose transcriptome.


Figures

Figure 1
Figure 1
Effect of calorie restriction or exercise in diet-induced obese mice on serum hormones and glucose tolerance. (a) Animal study design for gene expression microarray experiments. (b) Serum leptin levels, (c) serum adiponectin levels, and (d) serum insulin levels after 8 weeks of intervention, (n = 11 for DIO group; n = 10 for CR group; n = 10 for EX group). (e) Blood glucose concentrations during a glucose tolerance after 7 weeks of intervention. Data shown are mean ± SE. DIO (●), EX (), CR (□), n = 12/group. Significance (P ≤ .05) between groups is denoted by different letters.
Figure 2
Figure 2
Effect of weight loss induced by calorie restriction or exercise on mRNA expression in VWAT. (a) Venn Diagram of genes differentially expressed by CR and EX compared to DIO controls. (b) Classification of genes targeted by both CR and EX. (c) Heat map of genes related to metabolic processes affected by both CR and EX. (d) Classification of genes targeted uniquely by CR (n = 6/group).
Figure 3
Figure 3
Confirmation of microarray data analysis of mRNA expression in VWAT. Expression of mRNA transcripts in VWAT from DIO control, CR and EX mice (n = 7/group). (a) Leptin (Lep), (b) Uncoupling protein 1 (Ucp1), (c) Uncoupling protein 2 (Ucp2), (d) Solute carrier 2, family 4 (Slc2a4) (e) ATP-citrate lyase (Acly), and (f) SH2B adapter protein 2 (Sh2b2) (Data shown are mean ± SE, *(P ≤ .05)).
Figure 4
Figure 4
Lean phenotype is associated with lower blood glucose levels and elevated levels of Glut4 mRNA relative to control mice. (a) Study design for chromosomal immunoprecipitation experiments. (b) Average body weight of mice on DIO, overweight (control AIN-76A) diet, or a lean (CR) regimen to generate obese, overweight or lean mice (n = 5/group). Data shown are mean ± SE. (c) Fasting blood glucose levels of mice after 8 weeks of respective dietary regimen (n = 5/group). Data shown are mean ± SE. Significance (P < .05) between groups is denoted by different letters. (d) Relative mRNA expression of Glut4 in VWAT (n = 5/group). Significance (P < .05) between groups is denoted by different letters.
Figure 5
Figure 5
Calorie restriction increases histone H4 acetylation at the GLUT 4 promoter. (a) Relative quantification of Glut4 DNA immunoprecipitated with anti-trimethyl H4 antibody. (b) Relative quantification of Glut4 DNA immunoprecipitated with anti-acetyl H4 antibody (n = 3/group). Data shown are mean ± SE, *(P ≤ 0.05).

References

    1. Flegal KM, Carroll MD, Ogden CL, Curtin LR. Prevalence and trends in obesity among US adults, 1999–2008. Journal of the American Medical Association. 2010;303(3):235–241. - PubMed
    1. Li TY, Rana JS, Manson JE, et al. Obesity as compared with physical activity in predicting risk of coronary heart disease in women. Circulation. 2006;113(4):499–506. - PMC - PubMed
    1. Meisinger C, Döring A, Thorand B, Heier M, Löwel H. Body fat distribution and risk of type 2 diabetes in the general population: are there differences between men and women? The MONICA/KORA Augsburg Cohort Study. American Journal of Clinical Nutrition. 2006;84(3):483–489. - PubMed
    1. Calle EE, Rodriguez C, Walker-Thurmond K, Thun MJ. Overweight, obesity, and mortality from cancer in a prospectively studied cohort of U.S. Adults. New England Journal of Medicine. 2003;348(17):1625–1638. - PubMed
    1. Watson RT, Pessin JE. GLUT4 translocation: the last 200 nanometers. Cellular Signalling. 2007;19(11):2209–2217. - PubMed

LinkOut - more resources