. 2011;6(5):e19651.
doi: 10.1371/journal.pone.0019651. Epub 2011 May 16.

Platelets alter gene expression profile in human brain endothelial cells in an in vitro model of cerebral malaria

Affiliations

Platelets alter gene expression profile in human brain endothelial cells in an in vitro model of cerebral malaria

Mathieu Barbier et al. PLoS One. 2011.

Abstract

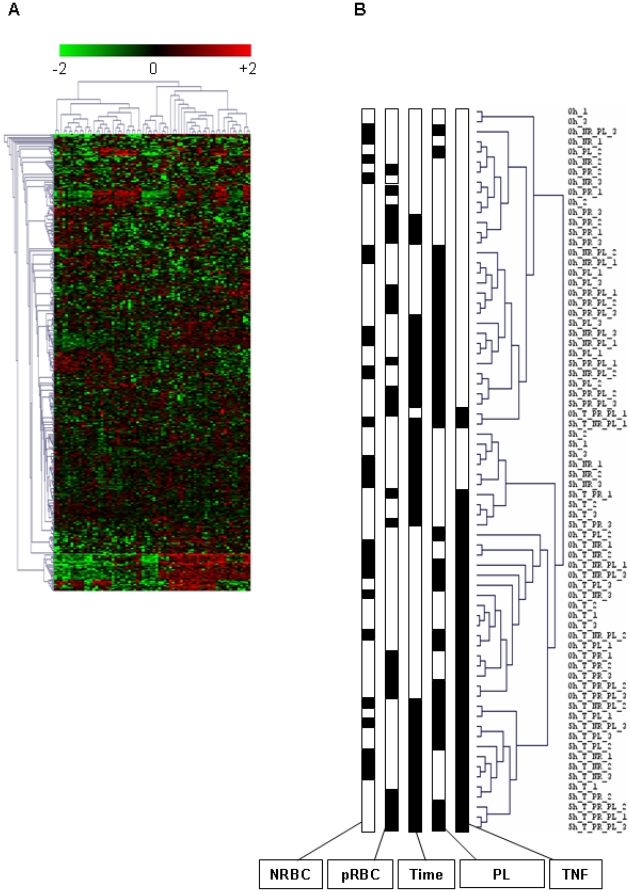
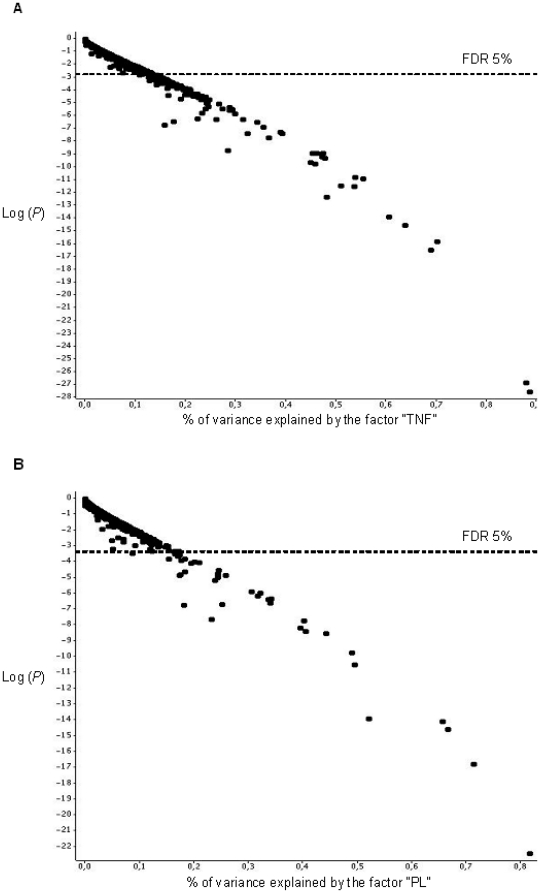
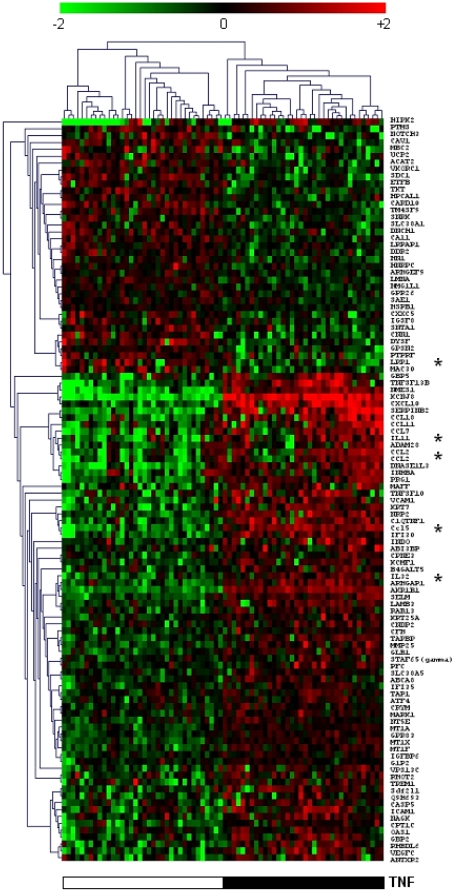
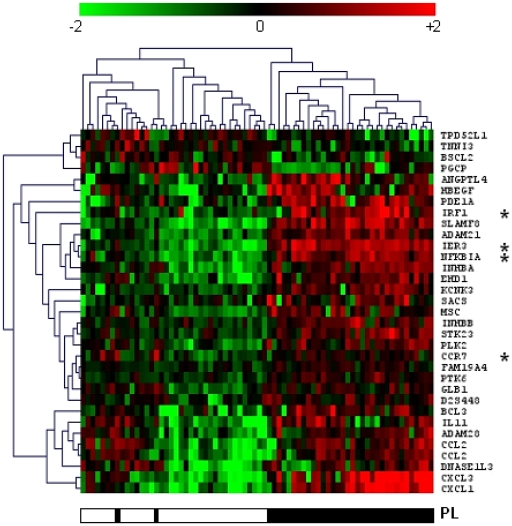
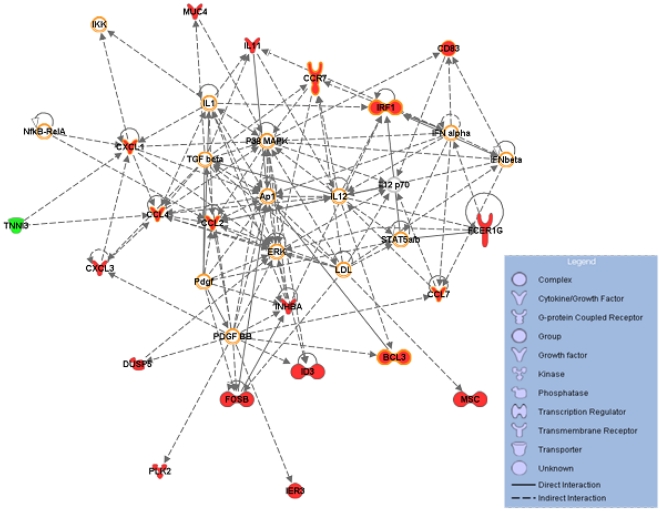
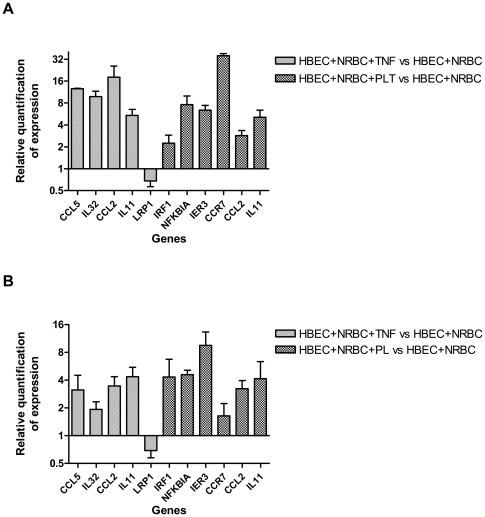
Platelet adhesion to the brain microvasculature has been associated with cerebral malaria (CM) in humans, suggesting that platelets play a role in the pathogenesis of this syndrome. In vitro co-cultures have shown that platelets can act as a bridge between Plasmodium falciparum-infected red blood cells (pRBC) and human brain microvascular endothelial cells (HBEC) and potentiate HBEC apoptosis. Using cDNA microarray technology, we analyzed transcriptional changes of HBEC in response to platelets in the presence or the absence of tumor necrosis factor (TNF) and pRBC, which have been reported to alter gene expression in endothelial cells. Using a rigorous statistical approach with multiple test corrections, we showed a significant effect of platelets on gene expression in HBEC. We also detected a strong effect of TNF, whereas there was no transcriptional change induced specifically by pRBC. Nevertheless, a global ANOVA and a two-way ANOVA suggested that pRBC acted in interaction with platelets and TNF to alter gene expression in HBEC. The expression of selected genes was validated by RT-qPCR. The analysis of gene functional annotation indicated that platelets induce the expression of genes involved in inflammation and apoptosis, such as genes involved in chemokine-, TREM1-, cytokine-, IL10-, TGFβ-, death-receptor-, and apoptosis-signaling. Overall, our results support the hypothesis that platelets play a pathogenic role in CM.


Conflict of interest statement

Competing Interests: The authors have declared that no competing interests exist.

Figures

Figure 1
Figure 1. Hierarchical clustering of HBEC responses to NRBC, pRBC, TNF, and platelets.
A) Hierarchical clustering of 72 samples was done on the basis of the expression of 469 genes that were selected by using a one-way ANOVA. Each row represents a gene, and each column an experimental sample. Red and green indicate expression levels above and below the median for each gene, respectively. Similarities in gene expression are represented by dendogrammes of samples and genes. B) Dendogramme of samples. 24 experimental conditions and 3 samples per condition are represented. For each condition, the presence (black) or the absence (white) of factors is specified. The factors are NRBC (−/+), pRBC (−/+), co-culture time (0 h and 5 h), PL (−/+), and TNF (−/+).
Figure 2
Figure 2. Gene expression variance analysis.
Each gene was plotted as a point. The abscissa is the variation due to the factor normalized by the total variation of the gene, and the ordinate is the logarithm of the P-value. The nominal P-value that corresponded to a FDR of 5% is stated. The results are shown for the TNF (A) and PL (B) factors.
Figure 3
Figure 3. Hierarchical clustering of TNF-induced genes.
Hundred and seven TNF-induced genes were selected on the basis of a Welch t-test and a FDR of 5%. The samples obtained from HBEC stimulated with TNF were compared with those from HBEC incubated without TNF. The presence (black) and the absence (white) of TNF are shown. Genes marked with an asterisk were validated by RT-qPCR.
Figure 4
Figure 4. Hierarchical clustering of platelet-induced genes.
A Welch t-test and a FDR of 5% led to identify 32 PL-induced genes. The samples obtained from HBEC co-cultured with PL were compared with those from HBEC incubated without PL. The presence (black) and the absence (white) of PL are shown. Genes marked with an asterisk were validated by RT-qPCR.
Figure 5
Figure 5. A gene network of platelet-regulated genes.
This network is the most significative network among five significative networks obtained using the 58 PL-regulated genes with IPA (supplementary data). Twenty genes of this network are differentially expressed in HBEC in presence of PL (colored in green for the down-regulated gene and red for up-regulated genes). The molecules hedged in orange belong to the main canonical pathways linked to this network (Acute phase response-, B cell receptor-, Chemokine-, Erythropoietin-, Glucocorticoid receptor-, IL6-, IL8-, IL10-, IL12-, PPAR-, RAR-, TREM-1-signaling, IRF, LXR/RXR, PPARa/RXRa, RAR activation, Role of pattern recognition receptor, Role of PKR in IFN induction, Hepatic cholestasis, Hepatic fibrosis).
Figure 6
Figure 6. Comparison of the expression of selected genes assessed by RT-qPCR and by microarray technology.
Five TNF-induced genes and 6 PL-induced genes were selected from the list of genes identified through Welch t-tests and multiple test corrections. For 2 genes (CCL2 and IL11), gene expression was regulated by TNF and PL. HBEC were co-cultured with NRBC in the presence or the absence of either TNF or PL to measure the expression of TNF- or PL-specific genes, respectively. A) Gene expression was assessed by RT-qPCR. Data were analyzed by the 2−ΔΔC(t) method with ACTB as a control gene. The n-fold value represents the mean of TNF- and PL-induced expression levels compared with control conditions. Error bar represents SD between duplicates. B) Gene expression was assessed by microarray technology. The n-fold value was calculated on the basis of normalized data when comparing the levels of TNF- and PL-induced expression with those of control conditions. Error bar represents SD between triplicates.

Similar articles

Cited by

References

    1. Marsh K, Snow RW. Malaria transmission and morbidity. Parassitologia. 1999;41:241–246. - PubMed
    1. van der Heyde HC, Nolan J, Combes V, Gramaglia I, Grau GE. A unified hypothesis for the genesis of cerebral malaria: sequestration, inflammation and hemostasis leading to microcirculatory dysfunction. Trends Parasitol. 2006;22:503–508. - PubMed
    1. Flori L, Delahaye NF, Iraqi FA, Hernandez-Valladares M, Fumoux F, et al. TNF as a malaria candidate gene: polymorphism-screening and family-based association analysis of mild malaria attack and parasitemia in Burkina Faso. Genes Immun. 2005;6:472–480. - PubMed
    1. Grau GE, Mackenzie CD, Carr RA, Redard M, Pizzolato G, et al. Platelet accumulation in brain microvessels in fatal pediatric cerebral malaria. J Infect Dis. 2003;187:461–466. - PubMed
    1. Sun G, Chang WL, Li J, Berney SM, Kimpel D, et al. Inhibition of platelet adherence to brain microvasculature protects against severe Plasmodium berghei malaria. Infect Immun. 2003;71:6553–6561. - PMC - PubMed

Publication types

Substances