. 2011;6(5):e19896.
doi: 10.1371/journal.pone.0019896. Epub 2011 May 13.

Modeling routes of chronic wasting disease transmission: environmental prion persistence promotes deer population decline and extinction

Affiliations

Modeling routes of chronic wasting disease transmission: environmental prion persistence promotes deer population decline and extinction

Emily S Almberg et al. PLoS One. 2011.

Abstract

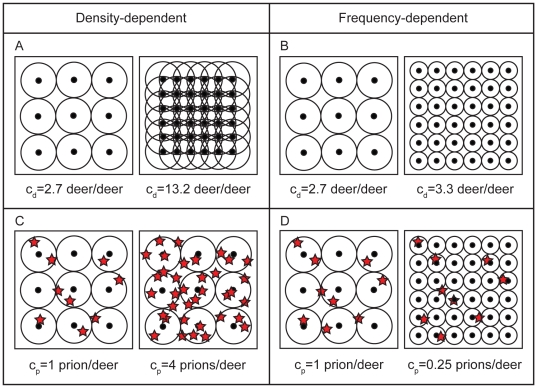
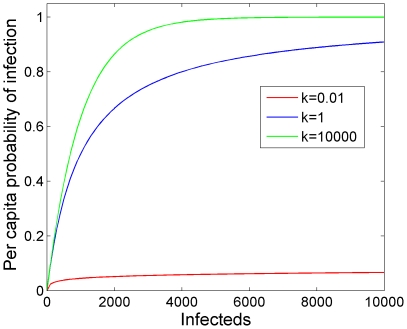
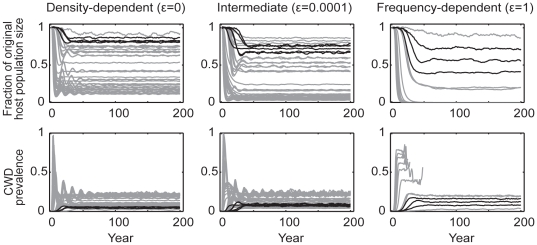
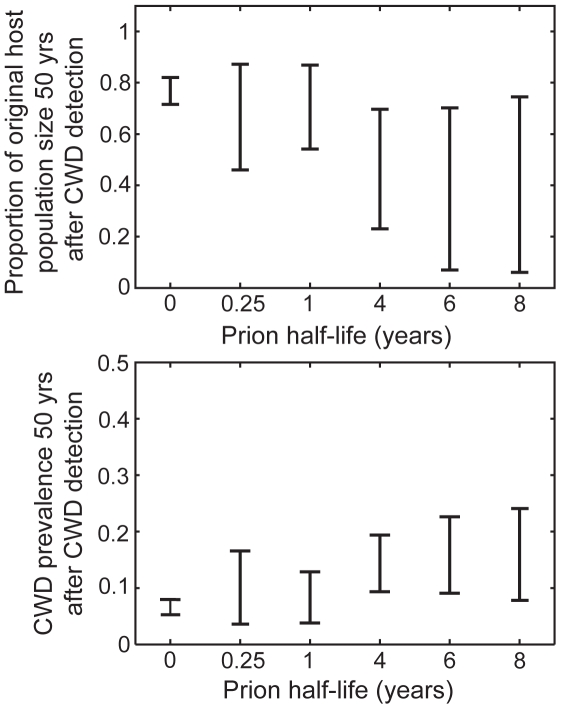
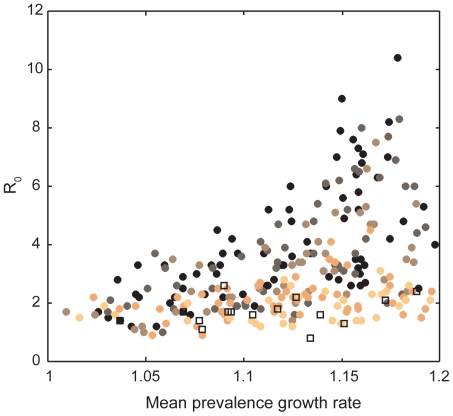
Chronic wasting disease (CWD) is a fatal disease of deer, elk, and moose transmitted through direct, animal-to-animal contact, and indirectly, via environmental contamination. Considerable attention has been paid to modeling direct transmission, but despite the fact that CWD prions can remain infectious in the environment for years, relatively little information exists about the potential effects of indirect transmission on CWD dynamics. In the present study, we use simulation models to demonstrate how indirect transmission and the duration of environmental prion persistence may affect epidemics of CWD and populations of North American deer. Existing data from Colorado, Wyoming, and Wisconsin's CWD epidemics were used to define plausible short-term outcomes and associated parameter spaces. Resulting long-term outcomes range from relatively low disease prevalence and limited host-population decline to host-population collapse and extinction. Our models suggest that disease prevalence and the severity of population decline is driven by the duration that prions remain infectious in the environment. Despite relatively low epidemic growth rates, the basic reproductive number, R(0), may be much larger than expected under the direct-transmission paradigm because the infectious period can vastly exceed the host's life span. High prion persistence is expected to lead to an increasing environmental pool of prions during the early phases (i.e. approximately during the first 50 years) of the epidemic. As a consequence, over this period of time, disease dynamics will become more heavily influenced by indirect transmission, which may explain some of the observed regional differences in age and sex-specific disease patterns. This suggests management interventions, such as culling or vaccination, will become increasingly less effective as CWD epidemics progress.


Conflict of interest statement

Competing Interests: The authors have declared that no competing interests exist.

Figures

Figure 1
Figure 1. Schematic of density (DD) and frequency (FD) dependent transmission applied to direct and indirect transmission.
Dots and circles represent deer and their home ranges, and red stars represent infectious prions in the environment. Deer and prion contacts (means denoted by and cd and cp) are defined by shared or overlapping home range edges, and home range overlap with prions, respectively. A) Under DD direct transmission, increasing host density (by a factor of 4) is assumed to increase host contact rates. B) Under FD direct transmission, spatial or social structuring keeps contact rates largely independent of host density (the slight increase displayed is due to edge effects). C) Under DD indirect transmission, increasing prion density (by a factor of 4) increases prion contacts. D) Under FD indirect transmission, prion contacts scale with host density; as host density increases, spatial structuring reduces home range size and hence per capita rates of prion contact.
Figure 2
Figure 2. Aggregation and the probability of infection.
Aggregation reduces the rate at which additional infectious individuals or particles contribute to the probability of infection. High aggregation is represented by k = 0.01, where as low aggregation is represented by k = 10000. Simulation run assuming density-dependent (ε = 0) direct transmission with βd = 0.001.
Figure 3
Figure 3. Simulations of CWD among 15,000 mule deer assuming only direct transmission.
Host population dynamics (the fraction of the original host population size over time) and CWD prevalence are given assuming density-dependent (ε = 0), intermediate (ε = 0.0001), and frequency-dependent (ε = 1) transmission (columns 1, 2, and 3, respectively). Plots include aggregated (k = 0.01, 1) and non-aggregated (k = 10000) data. Lines represent the average of active simulations (mean = 8.8, sd = 1.9, range = 1–10) per direct transmission rate. Grey lines represent all possible outcomes, whereas black lines represent plausible outcomes, based on the epidemic characteristics observed in Colorado, Wyoming, and Wisconsin. None of the plausible simulation runs resulted in host extinction.
Figure 4
Figure 4. The relationship between peak prevalence and prevalence growth rate is modulated by prion persistence and the functional form of transmission.
The mean prevalence growth rate calculated as the average growth rate during the first 10 years of the CWD epidemic, is plotted against the peak prevalence reached over the course of the entire CWD epidemic for (A) density-dependent (ε = 0), (B) intermediate (ε = 0.0001), and (C) frequency-dependent (ε = 1) transmission scenarios that assume both direct and indirect transmission. Plots include simulations with aggregated (k = 0.01, 1) and non-aggregated (k = 10000) transmission risk. Prion persistence is represented by color (cyan = direct transmission only, red = 3 month half life (HL), dark blue = 1 yr HL, green = 4 yr HL, yellow = 6 yr HL, black = 8 yr HL). Gray symbols represent model simulations that were not considered plausible given the epidemic characteristics observed in Colorado, Wyoming, and Wisconsin. Note the scale difference in the y-axis between plots A, B, and C. See Table 1 for βd and βi values employed in these simulations.
Figure 5
Figure 5. Impacts of prion half-life on host population size and disease prevalence.
Ranges of plausible host population sizes (represented as the fraction of original host population size) (A) and disease prevalence (B), 50 years after the initial detection of CWD, as a function of prion half-life. Plots include results from simulations assuming density-dependent (ε = 0) and weakly frequency-dependent (ε = 0.001) indirect transmission, as well as aggregated (k = 0.01, 1) and non-aggregated (k = 10000) transmission risk (see Table 1 for βd and βi values). Results from simulations that assume only direct transmission (prion half-life = 0) are plotted for comparison. Plotted data represent only “plausible” outcomes which match the epidemic characteristics observed in the Colorado, Wyoming, and Wisconsin outbreaks. Ranges, rather than boxplots, are displayed since variation in sampling intensity may bias mean or median values.
Figure 6
Figure 6. Dynamics of chronic wasting disease given a range of both direct and indirect transmission.
Simulations of CWD among 15,000 mule deer were run assuming a wide range of direct and indirect transmission rates, density-dependent (ε = 0), intermediate (ε = 0.0001), and frequency-dependent (ε = 1) transmission (columns 1, 2, and 3, respectively), and a range of aggregation in infection risk (k = 0.01, 1, 10000; not distinguished in this figure). Host population dynamics, CWD prevalence, the environmental prion load, and the proportion of runs resulting in host extinction are displayed. Lines represent the average of active simulations (mean = 9.1, sd = 1.5, range = 2–10) per combination of direct and indirect transmission rates, prion survival, and aggregation. Grey lines represent all possible outcomes, whereas colored lines represent “plausible” outcomes assuming different prion survival rates (for ease of interpretation, only a subset of prion survival rates are presented: blue = 1 yr half-life (HL), green = 4 yr HL, and black = 8 yr HL). See Table 1 for βd and βi values employed in these simulations.
Figure 7
Figure 7. The basic reproductive number, R 0, as a function of the prevalence growth rate and prion persistence.
The mean prevalence growth rate is calculated as the average growth rate during the first 10 years of the CWD epidemic. Each point represents the average value for 10 simulations per unique combination of direct and indirect transmission rates, functional forms of transmission, aggregation, and prion persistence. Prion persistence ranges from low (lightest circles = 0.25 year half-life) to high (black circles = 8 year half-life). The empty squares represent values assuming only direct transmission. Plotted data represent only “plausible” simulation results. See Table 1 for βd and βi values employed in these simulations.
Figure 8
Figure 8. The proportion of the force of infection due to indirect transmission increases over time and varies with respect to prion survival.
Gray lines represent typical dynamics when prion survival is low (0.25 year half-life), whereas black lines represent typical dynamics when prion survival is high (8 year half-life). The two lines plotted for each value of prion survival represent the cases where the starting ratio of indirect: direct transmission is either high (upper gray line, βd = 7.5e−7; βi = 5.75e−8; upper black line, βd = 2.25e−6; βi = 1.75e−8) or low (lower gray line, βd = 2.5e−6; βi = 1.1e−8; lower black line, βd = 7.5e−6; βi = 7.5e−9). Although not displayed here, all ranges of starting ratios are possible, but the patterns for low versus high prion survival remain the same.

References

    1. Anderson RM, May RM. Infectious Diseases of Humans: Dynamics and Control. New York: Oxford University Press.; 1991. 757
    1. Pedersen AB, Jones KE, Nunn CL, Altizer S. Infectious diseases and extinction risk in wild mammals. Conservation Biology. 2007;21:1269–1279. - PMC - PubMed
    1. Rohani P, Breban R, Stallknecht DE, Drake JM. Environmental transmission of low pathogenicity avian influenza viruses and its implications for pathogen invasion. Proceedings of the National Academy of Sciences. 2009;106:10365–10369. - PMC - PubMed
    1. Sauvage F, Langlais M, Yoccoz NG, Pontier D. Modelling hantavirus in fluctuating populations of bank voles: the role of indirect transmission on virus persistence. Journal of Animal Ecology. 2003;72:1–13.
    1. Berthier K, Langlais M, Auger P, Pontier D. Dynamics of a Feline Virus with Two Transmission Modes within Exponentially Growing Host Populations. Proceedings: Biological Sciences. 2000;267:2049–2056. - PMC - PubMed

Publication types