. 2011 Aug 15;438(1):111-9.
doi: 10.1042/BJ20101939.

Farnesyl pyrophosphate regulates adipocyte functions as an endogenous PPARγ agonist

Affiliations

Farnesyl pyrophosphate regulates adipocyte functions as an endogenous PPARγ agonist

Tsuyoshi Goto et al. Biochem J. .

Abstract

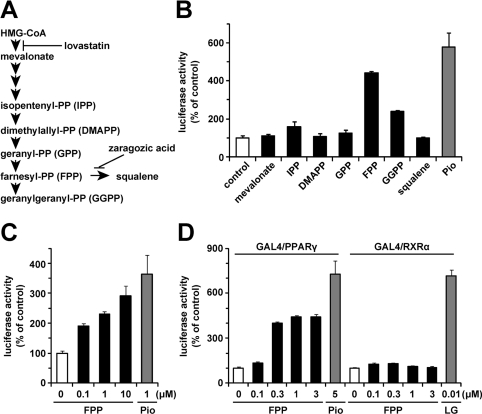
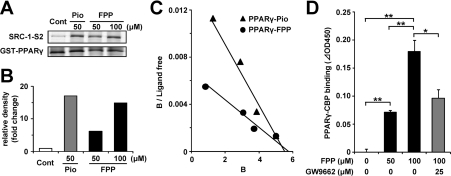
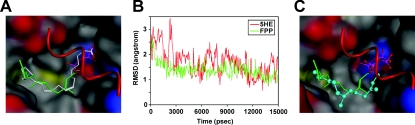
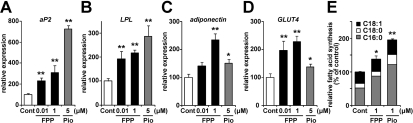
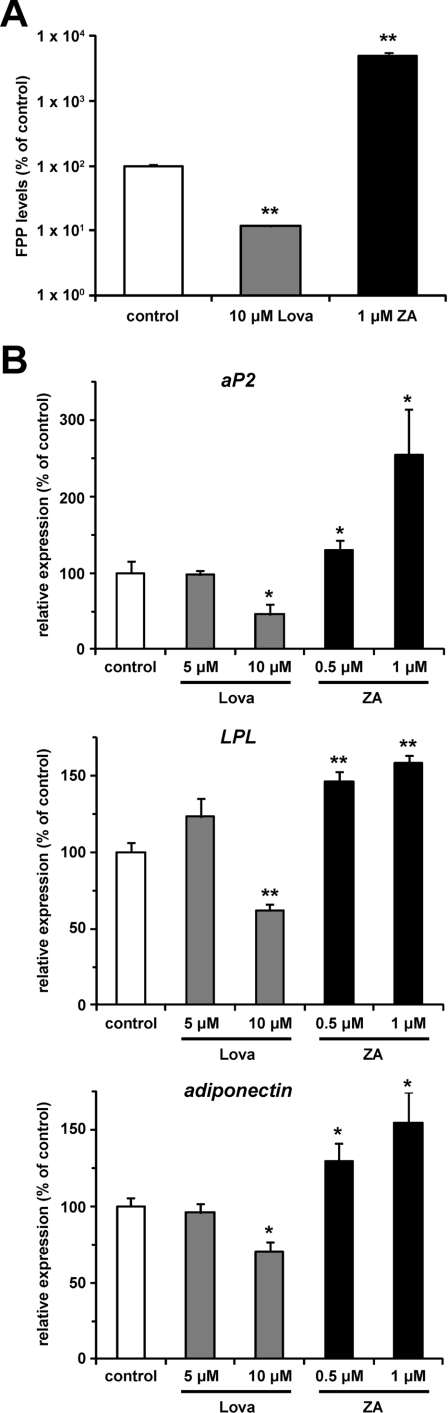
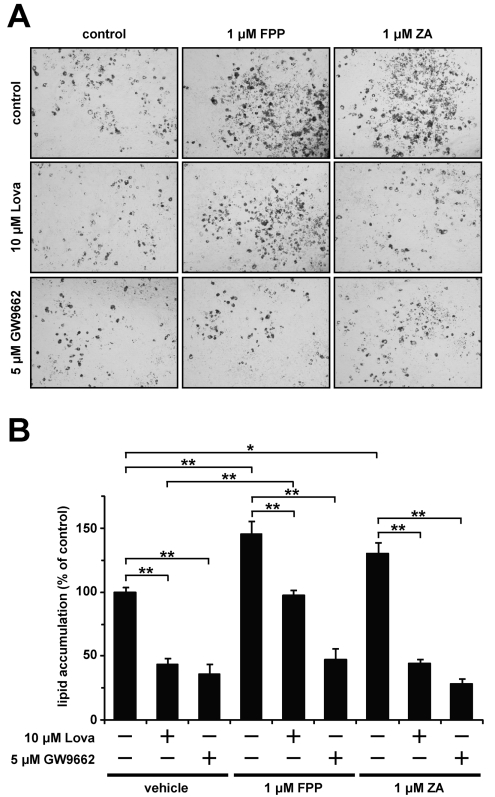
The cholesterol biosynthetic pathway produces not only sterols but also non-sterol mevalonate metabolites involved in isoprenoid synthesis. Mevalonate metabolites affect transcriptional and post-transcriptional events that in turn affect various biological processes including energy metabolism. In the present study, we examine whether mevalonate metabolites activate PPARγ (peroxisome-proliferator-activated receptor γ), a ligand-dependent transcription factor playing a central role in adipocyte differentiation. In the luciferase reporter assay using both GAL4 chimaera and full-length PPARγ systems, a mevalonate metabolite, FPP (farnesyl pyrophosphate), which is the precursor of almost all isoprenoids and is positioned at branch points leading to the synthesis of other longer-chain isoprenoids, activated PPARγ in a dose-dependent manner. FPP induced the in vitro binding of a co-activator, SRC-1 (steroid receptor co-activator-1), to GST (glutathione transferase)-PPARγ. Direct binding of FPP to PPARγ was also indicated by docking simulation studies. Moreover, the addition of FPP up-regulated the mRNA expression levels of PPARγ target genes during adipocyte differentiation induction. In the presence of lovastatin, an HMG-CoA (3-hydroxy-3-methylglutaryl-CoA) reductase inhibitor, both intracellular FPP levels and PPARγ-target gene expressions were decreased. In contrast, the increase in intracellular FPP level after the addition of zaragozic acid, a squalene synthase inhibitor, induced PPARγ-target gene expression. The addition of FPP and zaragozic acid promotes lipid accumulation during adipocyte differentiation. These findings indicated that FPP might function as an endogenous PPARγ agonist and regulate gene expression in adipocytes.


Figures

Figure 1
Figure 1. FPP activates PPARγ as shown by luciferase reporter assay
(A) Schematic illustration of the mevalonate pathway. The targets of lovastatin and zaragozic acid are also shown. (BD) Effects of mevalonate metabolites (1 μM) or FPP on PPARγ or RXRα activity in a luciferase reporter assay using the GAL4/PPARγ chimaera system (B), full-length PPARγ system (C) or GAL4/PPARγ and GAL4/RXRα chimaera system (D). CV1 monkey kidney cells were transfected with pM-PPARγ, p4xUASg-tk-luc and pRL-CMV (B), pDEST-hPPARγ, p3xPPRE-tk-luc and pRL-CMV (C), or pM-PPARγ/pM-RXRα, p4xUASg-tk-luc and pRL-CMV (D). Cells were incubated in a medium with each mevalonate metabolite, Pio or LG100268 (LG; a synthetic RXR agonist) for another 24 h after the transfection. The activity of a vehicle control was set at 100% and the obtained relative luciferase activities are presented as the fold induction with respect to that in the vehicle control. All of the values are the means±S.E.M. for three or four tests.
Figure 2
Figure 2. FPP induces the recruitment of co-activators to PPARγ in vitro
(A) GST pull-down assay using full-length PPARγ protein. Recombinant SRC-1 fragment (SRC-1-S2) containing a PPAR-binding region was incubated with GST–human PPARγ and vehicle control, 50 μM Pio or 50 μM/100 μM FPP. After washing, the bound recombinant SRC-1 protein was detected by immunoblotting. Total GST–PPARγ protein was detected by Coomassie Brilliant Blue staining. The results are representative of three independent blots. (B) The densitometric analysis of immunoblotting membranes normalized by the amount of GST–PPARγ of (A) is shown. The density of the vehicle control was set at 1 and the relative densities were presented as the fold induction relative to that of the vehicle control. (C) Scatchard plot analysis of the binding of a PPARγ triangles ligand complex to the TAMRA–SRC-1 in the presence of pioglitazone (Pro; closed triangles) or FPP (closed circles). As the control experiment, TAMRA–SRC-1 was incubated together with GST protein. Ligand concentrations (in μM) at all data points are 0.15, 1.0, 2.0 and 3.8 for FPP and 0.1, 0.4, 1.2 and 3.8 for Pio from the left data point respectively. The results are representative of five independent blots. (D) The recruitment of CBP to PPARγ in the presence or absence of FPP (50 or 100 μM) and GW9662 (25 μM) was determined by ELISA. All the values are means±S.E.M. for three to five tests. *P<0.05, **P<0.01.
Figure 3
Figure 3. FPP can directly bind to PPARγ as an agonist in a docking simulation study
(A) Modelling of the docking position of FPP in PPARγ protein by referring to the X-ray crystal structure of the 5HE–PPARγ complex. FPP (green carbon atoms) and 5HE (white carbon atoms) are represented as a stick model. The protein surface is shown in the colour of the atom. Colours: grey, carbon; red, oxygen; blue, nitrogen; yellow, sulfur. The α-helix by which the ligand-binding site is covered is represented by a red Cα-trace model. (B) RMSD of carbon atoms for FPP (green) and 5HE (red). Each complex structure during simulation is overlapped on the structure at 15000 ps with Cα root-mean-square fitting. (C) Difference between MD-simulated pose at 15000 ps (ball and stick model) and the initial pose of MD simulation (stick model).
Figure 4
Figure 4. The addition of FPP up-regulates PPARγ target genes and promotes de novo fatty acid synthesis
(AD) Expression levels of adipogenic marker genes, such as aP2 (A), LPL (B), adiponectin (C) and GLUT4 (D), in 3T3-L1 cells treated with or without FPP. 3T3-L1 cells were induced to differentiate with or without 0.01 μM/1 μM FPP or 5 μM Pio for 48 h. Total RNA was isolated and analysed by real-time monitoring RT–PCR. mRNA expression levels of each gene were normalized to the expression levels of the ribosomal 36B4 gene. The expression level of cells treated with the vehicle control is set at 100% and relative expression levels are presented as the fold inductions over the vehicle control. (E) Rate of de novo fatty acid synthesis from glucose after chronic FPP treatment during adipocyte differentiation. 3T3-L1 cells were induced to differentiate and maintained with or without 1 μM FPP or 1 μM Pio for 10 days. Cells were analysed using [13C6]-glucose and the LC/MS system as described in the Materials and methods section. All of the values are means±S.E.M. for five or six tests. *P<0.05, **P<0.01 compared with vehicle controls.
Figure 5
Figure 5. Endogenous FPP might regulate PPARγ activity during induction of adipocyte differentiation
(A) Intracellular FPP levels in NIH 3T3 cells treated with or without lovastatin (Lova) or zaragozic acid (ZA). NIH 3T3 cells treated with vehicle control, 10 μM Lova or 1 μM ZA for 48 h were extracted with butanol/75 mM ammonium hydroxide/ethanol (1:1.25:2.75, by vol.) and the intracellular FPP level was determined as described in the Materials and methods section. All of the values are means±S.E.M. for three tests. (B) mRNA expression levels of aP2, LPL and adiponectin in 3T3-L1 cells treated with or without Lova or ZA. 3T3-L1 cells were induced to differentiate with vehicle control, Lova (5 or 10 μM) or ZA (0.5 or 1 μM) for 48 h. mRNA expression levels were determined as described in Figure 4. All the values are means±S.E.M. for four to six tests. *P<0.05, **P<0.01 compared with vehicle controls.
Figure 6
Figure 6. FPP promotes lipid accumulation during adipocyte differentiation
(A, B) 3T3-L1 cells were induced to differentiate with or without the indicated compounds for 48 h. The cells were incubated with or without the indicated compounds for an additional 2 days. The cells were fixed with formalin, and stained with Oil Red O. Microscopy views of representative 3T3-L1 cells (the original magnification is ×100) (A). Oil Red O was extracted from the cells with isopropyl alcohol and attenuance was measured at 490 nm (B). The levels of Oil Red O staining were corrected for the levels of non-specific binding levels of the stain to untreated cells. The values are means±S.E.M. for four tests. *P<0.05, **P<0.01.

Comment in

References

    1. Kadowaki T., Yamauchi T., Kubota N., Hara K., Ueki K., Tobe K. Adiponectin and adiponectin receptors in insulin resistance, diabetes, and the metabolic syndrome. J. Clin. Invest. 2006;116:1784–1792. - PMC - PubMed
    1. Matsuzawa Y. The metabolic syndrome and adipocytokines. FEBS Lett. 2006;580:2917–2921. - PubMed
    1. Sakai T., Sakaue H., Nakamura T., Okada M., Matsuki Y., Watanabe E., Hiramatsu R., Nakayama K., Nakayama K. I., Kasuga M. Skp2 controls adipocyte proliferation during the development of obesity. J. Biol. Chem. 2007;282:2038–2046. - PubMed
    1. Spiegelman B. M., Flier J. S. Adipogenesis and obesity: rounding out the big picture. Cell. 1996;87:377–389. - PubMed
    1. Glass C. K. Going nuclear in metabolic and cardiovascular disease. J. Clin. Invest. 2006;116:556–560. - PMC - PubMed

Publication types

MeSH terms