. 2011 Jul 15;589(Pt 14):3533-44.
doi: 10.1113/jphysiol.2011.207191. Epub 2011 May 23.

Behaviour of the motoneurone pool in a fatiguing submaximal contraction

Affiliations

Behaviour of the motoneurone pool in a fatiguing submaximal contraction

Chris J McNeil et al. J Physiol. .

Abstract

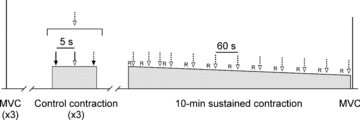
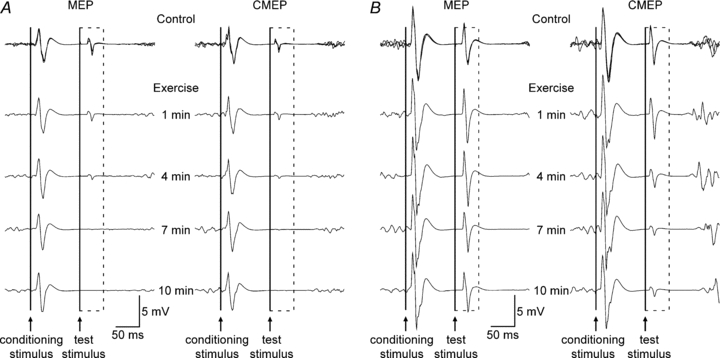
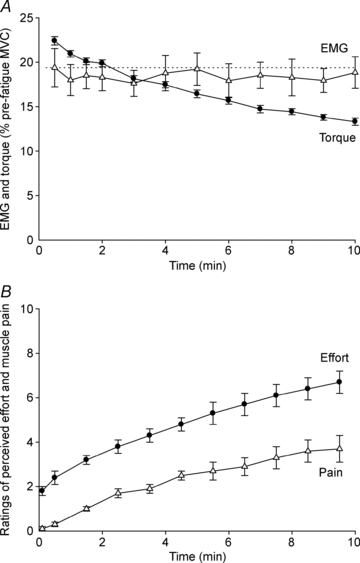
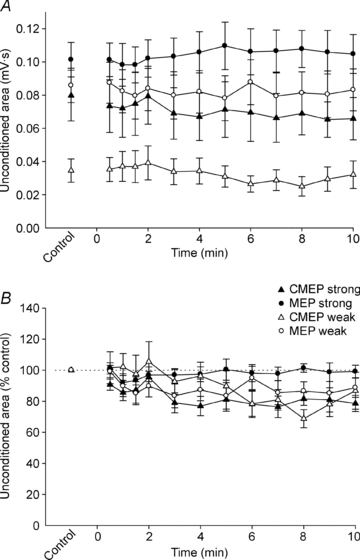
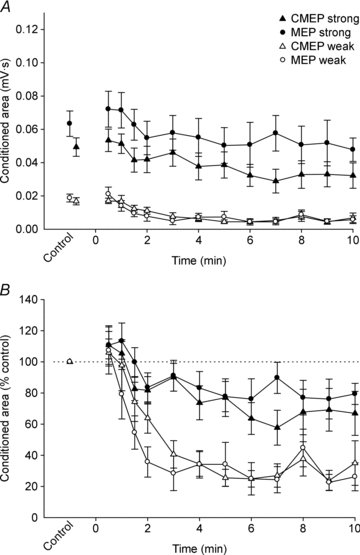
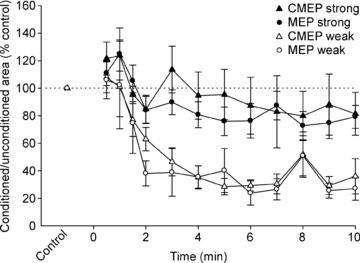
During fatigue caused by a sustained maximal voluntary contraction (MVC), motoneurones become markedly less responsive when tested during the silent period following transcranial magnetic stimulation (TMS). To determine whether this reduction depends on the repetitive activation of the motoneurones, responses to TMS (motor evoked potentials, MEPs) and to cervicomedullary stimulation (cervicomedullary motor evoked potentials, CMEPs) were tested during a sustained submaximal contraction at a constant level of electromyographic activity (EMG). In such a contraction, some motoneurones are repetitively activated whereas others are not active. On four visits, eight subjects performed a 10 min maintained-EMG elbow flexor contraction of 25% maximum. Test stimuli were delivered with and without conditioning by TMS given 100 ms prior. Test responses were MEPs or CMEPs (two visits each, small responses evoked by weak stimuli on one visit and large responses on the other). During the sustained contraction, unconditioned CMEPs decreased ∼20% whereas conditioned CMEPs decreased ∼75 and 30% with weak and strong stimuli, respectively. Conditioned MEPs were reduced to the same extent as CMEPs of the same size. The data reveal a novel decrease in motoneurone excitability during a submaximal contraction if EMG is maintained. Further, the much greater reduction of conditioned than unconditioned CMEPs shows the critical influence of voluntary drive on motoneurone responsiveness. Strong test stimuli attenuate the reduction of conditioned CMEPs which indicates that low-threshold motoneurones active in the contraction are most affected. The equivalent reduction of conditioned MEPs and CMEPs suggests that, similar to findings with a sustained MVC, impaired motoneurone responsiveness rather than intracortical inhibition is responsible for the fatigue-related impairment of the MEP during a sustained submaximal contraction.


Figures

Figure 1
Figure 1. Schematic diagram of the experimental protocol
Three brief control contractions were performed at the level of EMG produced at 25% MVC. During each control contraction, a stimulation sequence was delivered (dotted arrow, open arrowhead) which included a single test stimulus (continuous arrow, filled arrowhead), paired conditioning–test stimuli (continuous arrow, open arrowhead), and a brachial plexus stimulus (dotted arrow, filled arrowhead). This stimulation sequence was also delivered during the sustained 10 min contraction. Ratings of perceived effort and muscle pain (R) were collected during the during the sustained contraction. To assess the fatigue induced by the sustained contraction, a brief MVC was performed ∼5 s afterward.
Figure 2
Figure 2. Individual traces of biceps EMG recorded from single subjects using weak (A) or strong (B) test stimuli
Data in panels A and B were collected from different subjects. Responses obtained during the three brief control contractions with paired conditioning–test stimulation are overlaid. The time course of stimulation during the 10 min contraction is indicated between the two sets of traces. The dashed box surrounds the conditioned test MEPs (left) and CMEPs (right) evoked in the silent period following the conditioning TMS stimulus. The continuous vertical lines indicate the timing of the conditioning and test stimuli. A, using weak test stimuli, conditioned MEPs and CMEPs decreased in parallel. B, using strong test stimuli, the conditioned CMEPs decreased more than conditioned MEPs but this did not occur in all subjects (see Fig. 5). The suppression of both conditioned MEPs and CMEPs was less with strong than weak test stimuli.
Figure 3
Figure 3. Elbow flexor torque and biceps RMS EMG (A) and ratings of perceived effort and muscle pain (B) during a submaximal maintained-EMG contraction
Data are mean values (± SEM) of the four protocols. A, elbow flexor torque (•) and biceps RMS EMG (▵) obtained over 100 ms just prior to each unconditioned test stimulus. Both variables are expressed as a percentage of their value during the pre-fatigue MVC with the greatest peak torque. B, ratings of perceived effort (•) and muscle pain (▵) collected using an 11-point Borg scale.
Figure 4
Figure 4. Unconditioned test potentials during a submaximal maintained-EMG contraction
Data are mean values (± SEM) for unconditioned MEPs (○) and CMEPs (▵). Open and filled symbols show data from protocols with weak and strong test stimuli, respectively. A, absolute area of unconditioned MEPs and CMEPs. B, areas of unconditioned MEPs and CMEPs are normalised to Mmax recorded 10 s later and then expressed as a percentage of the mean normalised value obtained during the control contractions.
Figure 5
Figure 5. Conditioned test potentials during a submaximal maintained-EMG contraction
Data are mean values (± SEM) for conditioned MEPs (○) and CMEPs (▵). Open and filled symbols show data from protocols with weak and strong test stimuli, respectively. A, absolute area of conditioned MEPs and CMEPs. B, area of conditioned MEPs and CMEPs are expressed as a percentage of the mean value obtained during the control contractions.
Figure 6
Figure 6. Ratio of conditioned to unconditioned test potentials during a submaximal maintained-EMG contraction
Data are mean values (± SEM) for MEP (○) and CMEP (▵) inhibition ratios. Open and filled symbols show data from protocols with weak and strong test stimuli, respectively. The ratios of conditioned to unconditioned potentials are expressed as a percentage of the mean value obtained during the control contractions.

Comment in

References

    1. Benwell NM, Mastaglia FL, Thickbroom GW. Differential changes in long-interval intracortical inhibition and silent period duration during fatiguing hand exercise. Exp Brain Res. 2007;179:255–262. - PubMed
    1. Berardelli A, Inghilleri M, Rothwell JC, Cruccu G, Manfredi M. Multiple firing of motoneurones is produced by cortical stimulation but not by direct activation of descending motor tracts. Electroencephalogr Clin Neurophysiol. 1991;81:240–242. - PubMed
    1. Bigland-Ritchie BR, Dawson NJ, Johansson RS, Lippold OC. Reflex origin for the slowing of motoneurone firing rates in fatigue of human voluntary contractions. J Physiol. 1986;379:451–459. - PMC - PubMed
    1. Binder MD, Heckman CJ, Powers RK. The physiological control of motoneuron activity. In: Rowell LB, Shepherd JT, editors. Handbook of Physiology, section 12, Exercise: Regulation and Integration of Multiple Systems. Bethesda, SD: American Physiological Society; 1996. pp. 3–53.
    1. Borg G. Psychophysical scaling with applications in physical work and the perception of exertion. Scand J Work Environ Health. 1990;16(Suppl 1):55–58. - PubMed

Publication types

LinkOut - more resources