. 2011 Jul;156(3):1244-56.
doi: 10.1104/pp.111.173047. Epub 2011 May 23.

Gene coexpression network alignment and conservation of gene modules between two grass species: maize and rice

Affiliations

Gene coexpression network alignment and conservation of gene modules between two grass species: maize and rice

Stephen P Ficklin et al. Plant Physiol. 2011 Jul.

Abstract

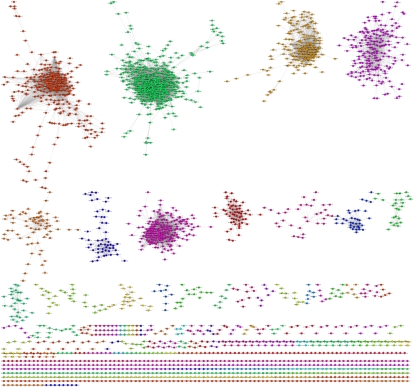
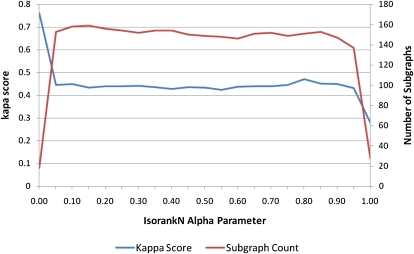
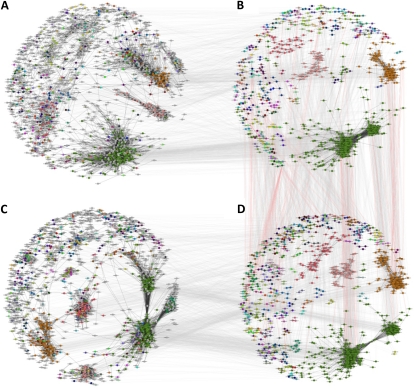
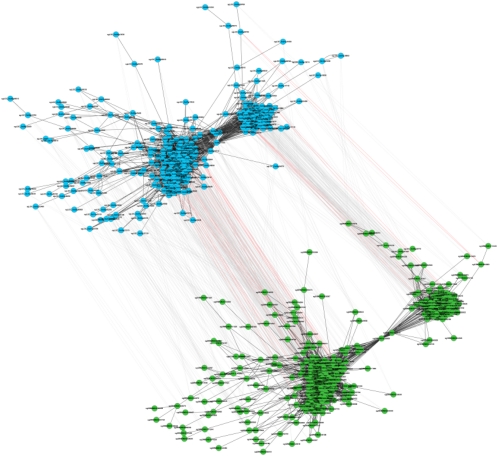
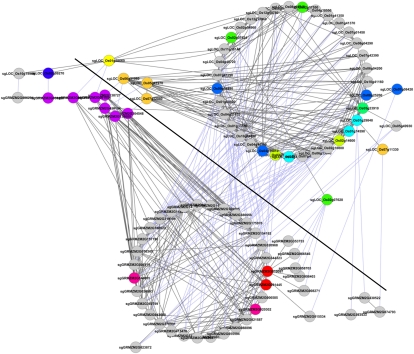
One major objective for plant biology is the discovery of molecular subsystems underlying complex traits. The use of genetic and genomic resources combined in a systems genetics approach offers a means for approaching this goal. This study describes a maize (Zea mays) gene coexpression network built from publicly available expression arrays. The maize network consisted of 2,071 loci that were divided into 34 distinct modules that contained 1,928 enriched functional annotation terms and 35 cofunctional gene clusters. Of note, 391 maize genes of unknown function were found to be coexpressed within modules along with genes of known function. A global network alignment was made between this maize network and a previously described rice (Oryza sativa) coexpression network. The IsoRankN tool was used, which incorporates both gene homology and network topology for the alignment. A total of 1,173 aligned loci were detected between the two grass networks, which condensed into 154 conserved subgraphs that preserved 4,758 coexpression edges in rice and 6,105 coexpression edges in maize. This study provides an early view into maize coexpression space and provides an initial network-based framework for the translation of functional genomic and genetic information between these two vital agricultural species.


Figures

Figure 1.
Figure 1.
Maize coexpression network. Nodes are probe sets from the Affymetrix GeneChip Maize Genome Array. Edges indicate significant coexpression between probe sets above a hard threshold. The various colors indicate the different modules of the network.
Figure 2.
Figure 2.
Varying the homology-to-topology ratio has little effect on conserved maize-rice subgraph discovery. This graph shows the distribution of the average κ scores (blue line) and the number of conserved subgraphs (red line) across 20 α values for IsoRankN at an iteration setting of 30 and a threshold value of 1e-4. This graph is a representative plot for 189 trials of IsoRankN where the iteration parameters varied at 10, 20, and 30 and the threshold parameter varied at 1e-3, 1e-4, and 1e-5. Other combinations yielded almost identical graphs. [See online article for color version of this figure.]
Figure 3.
Figure 3.
Conserved subgraphs between rice and maize. A, The global locus-based network for rice. B, The conserved network for rice with colored subgraphs. C, The global locus-based network for maize. D, The conserved network for maize with colored subgraphs. Nodes in B and D are color coded according to the conserved subgraphs to which they belong. The same colored nodes in B belong to the same conserved subgraph in D. These same nodes are colored identically in the global networks to show global placement. Nodes colored gray in the global networks are not assigned to a conserved subgraph. Dark-colored edges in the global and conserved subgraphs represent coexpression edges. Lightly colored lines between the global networks in A and C and the conserved subgraphs in B and D simply indicate the positions of the same nodes in both types of networks. Lightly colored gray lines between the conserved subgraphs of rice and maize in B and D show the locations of aligned nodes as indicated by IsoRankN. Lightly colored red lines between B and D originate from the rice conserved subgraph in B and indicate known phenotypic associations in rice with possible translation to maize.
Figure 4.
Figure 4.
Largest conserved subgraph with implied phenotypic associations. Shown is the largest conserved subgraph, subgraph_0107, between rice (blue nodes) and maize (green nodes). Dark edges in the subgraph are coexpression relationships. Light edges indicate alignments between the two subgraphs determined using IsoRankN. Light red edges indicate phenotypic associations with nodes in rice that are aligned to nodes in maize.
Figure 5.
Figure 5.
Subgraph_0282 from rice and maize. This subnetwork shows the coexpression edges and conserved alignments for all nodes of subgraph_0282 between maize and rice. Coexpression edges are gray lines, and network alignments are light blue lines. Nodes below the heavy diagonal line are from the maize network, and nodes above it are from rice. All of the rice nodes belong to module OsM13, and the majority of the maize nodes are from module ZmM5, with the exception of the three rightmost nodes in the bottom half, which belong to module Zm19. Yellow nodes in maize are for loci of unknown function. Purple nodes in maize are from cluster ZmM5C1, annotated for nutrient reservoir/seed storage activity. Orange nodes in rice are from cluster OsM13C1, also annotated for nutrient reservoir/seed storage activity. Nodes of other colors belong to the other functional clusters within the module. Gray nodes belong within the subgraph but are not part of a cofunctional cluster.

Similar articles

Cited by

References

    1. Aoki K, Ogata Y, Shibata D. (2007) Approaches for extracting practical information from gene co-expression networks in plant biology. Plant Cell Physiol 48: 381–390 - PubMed
    1. Apweiler R, Attwood TK, Bairoch A, Bateman A, Birney E, Biswas M, Bucher P, Cerutti L, Corpet F, Croning MD, et al. (2001) The InterPro database, an integrated documentation resource for protein families, domains and functional sites. Nucleic Acids Res 29: 37–40 - PMC - PubMed
    1. Ashburner M, Ball CA, Blake JA, Botstein D, Butler H, Cherry JM, Davis AP, Dolinski K, Dwight SS, Eppig JT, et al. (2000) Gene Ontology: tool for the unification of biology. Nat Genet 25: 25–29 - PMC - PubMed
    1. Atias O, Chor B, Chamovitz DA. (2009) Large-scale analysis of Arabidopsis transcription reveals a basal co-regulation network. BMC Syst Biol 3: 86. - PMC - PubMed
    1. Ayroles JF, Carbone MA, Stone EA, Jordan KW, Lyman RF, Magwire MM, Rollmann SM, Duncan LH, Lawrence F, Anholt RR, et al. (2009) Systems genetics of complex traits in Drosophila melanogaster. Nat Genet 41: 299–307 - PMC - PubMed

LinkOut - more resources