. 2011 Jun 7;108(23):9460-5.
doi: 10.1073/pnas.1102356108. Epub 2011 May 23.

Islet amyloid polypeptide demonstrates a persistent capacity to disrupt membrane integrity

Affiliations

Islet amyloid polypeptide demonstrates a persistent capacity to disrupt membrane integrity

Nicholas B Last et al. Proc Natl Acad Sci U S A. .

Abstract

Amyloid fiber formation is correlated with pathology in many diseases, including Alzheimer's, Parkinson's, and type II diabetes. Although β-sheet-rich fibrillar protein deposits define this class of disorder, increasing evidence points toward small oligomeric species as being responsible for cell dysfunction and death. The molecular mechanism by which this occurs is unknown, but likely involves the interaction of these species with biological membranes, with a subsequent loss of integrity. Here, we investigate islet amyloid polypeptide, which is implicated in the loss of insulin-secreting cells in type II diabetics. We report the discovery of oligomeric species that arise through stochastic nucleation on membranes and result in disruption of the lipid bilayer. These species are stable, result in all-or-none leakage, and represent a definable protein/lipid phase that equilibrates over time. We characterize the reaction pathway of assembly through the use of an experimental design that includes both ensemble and single-particle evaluations. Complexity in the reaction pathway could not be satisfied using a two-state description of membrane-bound monomer and oligomeric species. We therefore put forward a three-state kinetic framework, one of which we conjecture represents a non-amyloid, non-β-sheet intermediate previously shown to be a candidate therapeutic target.


Conflict of interest statement

The authors declare no conflict of interest.

Figures
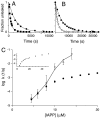
Fig. 1.
Fig. 1.
IAPP-induced leakage from liposomes. (A) Liposomes were prepared with encapsulated dye (Fluo-8 and Ca2+) and extraluminal EDTA. Representative leakage profiles at 10 μM (circles) and 20 μM (squares) IAPP are shown with solid lines representing single exponential fits. (B) Liposomes were prepared with membrane-associated Oregon Green DHPE. Representative leakage profiles are observed by addition of the fluorescence quencher, DPX, immediately (τDPX = 0 h, filled circles) or 2 d (τDPX = 48 h, unfilled circles) after addition of 8 μM IAPP to liposomes. (C) Semilog plot of average (N≥8) leakage rate constant versus protein concentration for initial (τDPX = 0 h, filled circles) and delayed leakage (τDPX = 48 h, unfilled circles). Solid line shows parameters derived from global fit of heterogeneous oligomer model (8) (see Discussion) to 50 kinetic profiles collected at equilibrium (τDPX = 48 h; see Fig. S5). (Inset) Replotting of data taken at τDPX = 0 h showing broader concentration range.
Fig. 2.
Fig. 2.
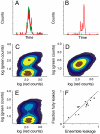
Single liposome analysis. Liposomes were prepared in which the lipid was doped with Texas Red DHPE. The lumen included encapsulated dye (Fluo-8 and Ca2+), and the extraluminal buffer contained EDTA. (A and B) Representative transits of single control liposomes representing either the unleaked (no IAPP) or fully leaked (20 μM IAPP, 20 h) state, respectively. Red and green traces correspond to leakage insensitive and sensitive fluorophores, respectively. The threshold for determining presence of a liposome was set at red fluorescence three standard deviations above background (dotted line). (C and D) Representative contoured density plots of liposome transits measured for 2 h (> 750 events) using a controlled, 1∶1 mixture of fully leaked and unleaked liposomes (C). Alternatively, a controlled sample was prepared representing idealized 50% leakage with extraluminal buffer (D). (E) Contour plot of liposomes measured for 2 h following incubation for 24 h with 5 μM IAPP. Contours for C, D, and E are geometrically spaced at 100.2 intervals. (F) Fraction of fully leaked liposomes versus the average leakage over the liposome ensemble. Data are plotted across 16 experiments (4–7 μM IAPP) with solid line drawn at 1∶1.
Fig. 3.
Fig. 3.
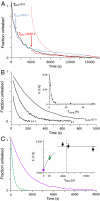
Measurement of leakage at time points after exposure to protein. Liposomes were prepared with encapsulated 70-kDa fluorescein dextran or membrane-associated Oregon Green DHPE. (A) Leakage profiles are observed by addition of the fluorescence quencher DPX at the indicated (τDPX) time points after addition of 8 μM IAPP. Dashed line shows predicted behavior at τDPX = 4,000 s for a model in which IAPP rapidly creates semipermeable pores (see main text). (B) Representative leakage profiles observed by addition of the fluorescence quencher, DPX, at the indicated (τDPX) time points after addition of 7 μM IAPP. (Inset) Statistical assessment (N = 3) of kinetics represented by (B) fitting single exponentials. Result is a plot of rate constants versus τDPX with solid line showing a single exponential fit to this data. (C) Acceleration of leakage rate upon secondary addition of protein. Liposomes were preincubated for 48 h with 7 μM IAPP. Leakage was measured via addition of DPX with (green) or without (violet) the further addition of 2 μM IAPP 30 s prior to measurement. (Inset) Statistics (N = 4) of the change in apparent leakage rate constant at time points, τDPX, after secondary addition of 2 μM protein. Starred point indicates the leakage rate constant prior to secondary protein addition. Dashed line shows the midpoint for initial equilibration of 7 μM IAPP (as determined in B). Note, rates observed in this figure are slightly elevated compared to Fig. 1 as a result of protocol-specific sample manipulation effects on protein concentration (see SI Materials and Methods).
Fig. 4.
Fig. 4.
Membrane leakage induced by amyloidogenic human IAPP. Liposomes were prepared with encapsulated 70-kDa fluorescein dextran. Leakage profiles are observed by addition of the fluorescence quencher DPX at the indicated time points (τDPX) after addition of 4 μM human IAPP. Amyloid formation (black) as measured in a matched dextran-free sample differing only by the addition of the amyloid indicator fluorophore, ThT.
Fig. 5.
Fig. 5.
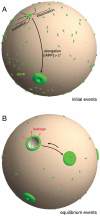
Minimal model sufficient to account for membrane leakage profiles. Schematics of liposomes (brown) with bound IAPP (green) are shown at initial and equilibrium time points. (A) Oligomers are initially formed by a nucleation-dependent mechanism, resulting in small unleaking oligomers. Above a critical concentration, c, these states can expand by further addition of IAPP. (B) All membrane-bound oligomers have the capacity to transiently adopt a leaking configuration from a non-leaking state. The rate at which the leaking configuration is sampled increases with increasing oligomer size.

References

    1. Chiti F, Dobson CM. Protein misfolding, functional amyloid, and human disease. Annu Rev Biochem. 2006;75:333–366. - PubMed
    1. Hebda JA, Miranker AD. The interplay of catalysis and toxicity by amyloid intermediates on lipid bilayers: Insights from type II diabetes. Annu Rev Biophys. 2009;38:125–152. - PubMed
    1. Haass C, Selkoe DJ. Soluble protein oligomers in neurodegeneration: Lessons from the Alzheimer’s amyloid beta-peptide. Nat Rev Mol Cell Biol. 2007;8:101–112. - PubMed
    1. Glabe CG. Common mechanisms of amyloid oligomer pathogenesis in degenerative disease. Neurobiol Aging. 2006;27:570–575. - PubMed
    1. Zraika S, et al. Toxic oligomers and islet beta cell death: Guilty by association or convicted by circumstantial evidence? Diabetologia. 2010;53:1046–1056. - PMC - PubMed

Publication types

MeSH terms

LinkOut - more resources