. 2011 Jun 7;108(23):9414-9.
doi: 10.1073/pnas.1019188108. Epub 2011 May 23.

Dynamics of enzymatic digestion of elastic fibers and networks under tension

Affiliations

Dynamics of enzymatic digestion of elastic fibers and networks under tension

Ascânio D Araújo et al. Proc Natl Acad Sci U S A. .

Abstract

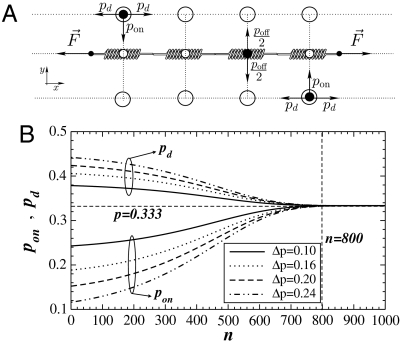
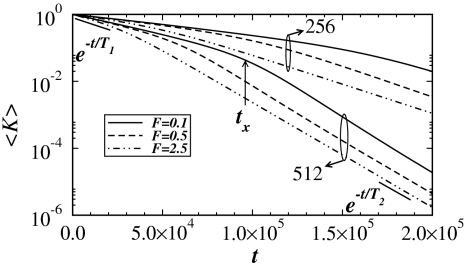
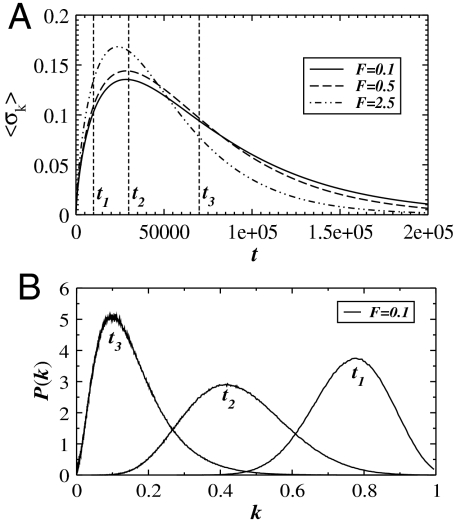
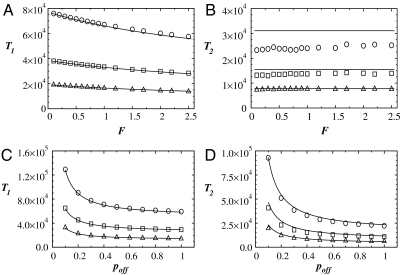
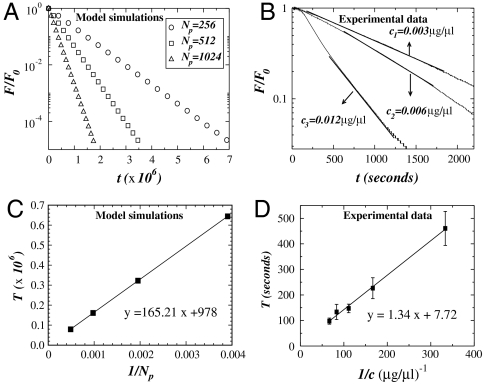
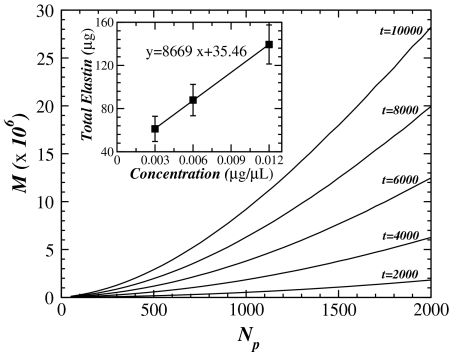
We study the enzymatic degradation of an elastic fiber under tension using an anisotropic random-walk model coupled with binding-unbinding reactions that weaken the fiber. The fiber is represented by a chain of elastic springs in series along which enzyme molecules can diffuse. Numerical simulations show that the fiber stiffness decreases exponentially with two distinct regimes. The time constant of the first regime decreases with increasing tension. Using a mean field calculation, we partition the time constant into geometrical, chemical and externally controllable factors, which is corroborated by the simulations. We incorporate the fiber model into a multiscale network model of the extracellular matrix and find that network effects do not mask the exponential decay of stiffness at the fiber level. To test these predictions, we measure the force relaxation of elastin sheets stretched to 20% uniaxial strain in the presence of elastase. The decay of force is exponential and the time constant is proportional to the inverse of enzyme concentration in agreement with model predictions. Furthermore, the fragment mass released into the bath during digestion is linearly related to enzyme concentration that is also borne out in the model. We conclude that in the complex extracellular matrix, feedback between the local rate of fiber digestion and the force the fiber carries acts to attenuate any spatial heterogeneity of digestion such that molecular processes manifest directly at the macroscale. Our findings can help better understand remodeling processes during development or in disease in which enzyme concentrations and/or mechanical forces become abnormal.


Conflict of interest statement

The authors declare no conflict of interest.

Figures

Fig. 1.
Fig. 1.
(A) Schematic diagram of the chain of springs and binding sites used in the model. The binding sites on the springs and the two layers of sites are represented by small and big open circles, respectively. The enzyme particles are shown as filled black circles. The particle at the bottom layer can move up, left, or right whereas the particle at the top can move down, left, or right. The particle on the spring can move only up or down. (B) The binding probability pon defined by Eq. 1 and the diffusion probability pd are a function of the number of visits n at a fixed site. Lines of different styles correspond to Δp = 0.10 (solid lines), Δp = 0.16 (dotted lines), Δp = 0.20 (dashed lines), and Δp = 0.24 (dash-dotted lines). The lines above and below the horizontal dashed line at p = 0.333 correspond to pd and pon, respectively. The vertical dashed line represents the region where the isotropic behavior with p = 0.333 is reached.
Fig. 2.
Fig. 2.
Log-linear plot of the average stiffness 〈K〉 as a function of diffusion time t for different values of F = 0.1, 0.5, 2.5 and Np = 256, 512 with Δp = 0.20 and poff = 0.5. The black solid line segments at the beginning and end of the simulations represent exponential fits to estimate the value of the time constants T1 and T2, respectively.
Fig. 3.
Fig. 3.
(A) The standard deviation 〈σk〉 of the local spring constants k as a function of time for three values of F = 0.1, 0.5, 2.5 and Np = 512. In panel B, we plot the distribution of spring constants P(k) at time points ti (i = 1, 2, 3) as indicated in panel A for F = 0.1. In both graphs, we use the parameters Δp = 0.20 and poff = 0.5.
Fig. 4.
Fig. 4.
Comparison of the mean field calculations and the numerical simulations. Time constants T1 and T2 are plotted as functions of F and poff for Np = 256 (circles), Np = 512 (squares), and Np = 1024 (triangles). The symbols correspond to the numerical simulations and the solid lines are obtained from Eq. 5. In panels A and B, T1 and T2 are shown as a function of F for a constant poff = 0.5. In panels C and D, T1 and T2 are shown as a function of poff for F = 1.0. In all graphs we used Δp = 0.20.
Fig. 5.
Fig. 5.
Linear-log plot of the force normalized by the initial force F0 as a function of time for both simulations and experiments. In panel A we show the force calculated by numerical simulations in a network composed of fibers arranged in a Voronoi network. All curves present an exponential decay with a time constant that depends on the number of particles Np. In panel B we show experimental results for the measured force in three elastin sheets. All curves show an exponential decay with a time constant that depends on enzyme concentration. For the numerical results, F0 corresponds to the estimated value obtained from the numerical fit of the data calculated for a single fiber, whereas for the experimental data, F0 is the value of the force measured before addition of enzyme. In panels C and D we plot the time constant T as a function of the inverse of the number of particles Np and enzyme concentration c, respectively. In the simulations, the time constant T is measured in time step and calculated with different initial configurations of the Voronoi network, averaged over 10 runs. The error bars are smaller than the symbol. The experimental time constant T has units of seconds and was obtained from the average over five different experiments for each concentration. The error bars increase as the concentration decreases. In both panels C and D, the solid lines represent the best linear fit to the data with R2 values of 0.999 and 0.998, respectively.
Fig. 6.
Fig. 6.
The main panel shows the amount of mass M as a function of the number of particles Np. The M represents the sum over all fragments released from the fiber during the digestion process and calculated from numerical simulations on a single fiber. Each solid line corresponds to the increase in M with particle concentration for different fixed time points t during the digestion process. The inset shows the results from experiments: the fragment mass M released into the bath at the end of 60-min digestion with three different elastase concentrations (0.003, 0.006, and 0.012 μg/μL). Each point was obtained from analysis of at least five samples for each concentration. The solid line represents the best linear fit to the data with an R2 value of 0.999.

References

    1. Ghajar CM, George SC, Putnam AJ. Matrix metalloproteinase control of capillary morphogenesis. Crit Rev Eukaryot Gene Expr. 2008;18:251–78. - PMC - PubMed
    1. Barnes PJ. Chronic obstructive pulmonary disease. N Engl J Med. 2000;343:269–280. - PubMed
    1. Jesudason R, Black L, Majumdar A, Stone P, Suki B. Differential effects of static and cyclic stretching during elastase digestion on the mechanical properties of extracellular matrices. J Appl Physiol. 2007;103:803–811. - PubMed
    1. Jesudason R, et al. Mechanical forces regulate elastase activity and binding site availability in lung elastin. Biophys J. 2010;99:3076–3083. - PMC - PubMed
    1. Flynn BP, et al. Mechanical strain stabilizes reconstituted collagen fibrils against enzymatic degradation by mammalian collagenase matrix metalloproteinase 8 (MMP-8) PLoS ONE. 2010;5:e12337. - PMC - PubMed

Publication types

LinkOut - more resources