. 2011 Jun 28;108(26):10591-6.
doi: 10.1073/pnas.1015178108. Epub 2011 May 23.

Systematic variation in the temperature dependence of physiological and ecological traits

Affiliations

Systematic variation in the temperature dependence of physiological and ecological traits

Anthony I Dell et al. Proc Natl Acad Sci U S A. .

Abstract

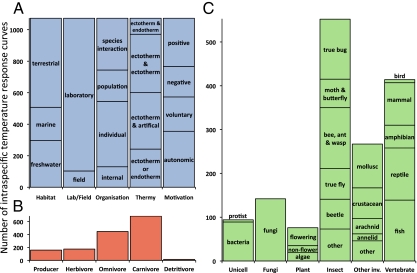
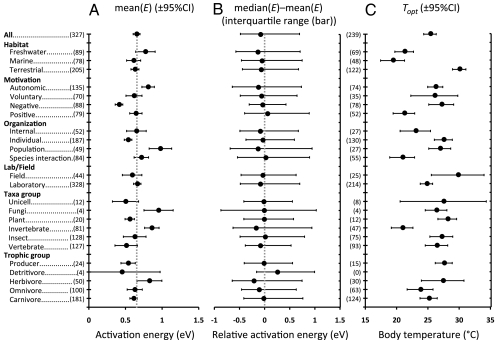
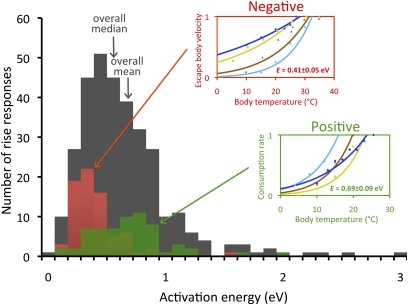
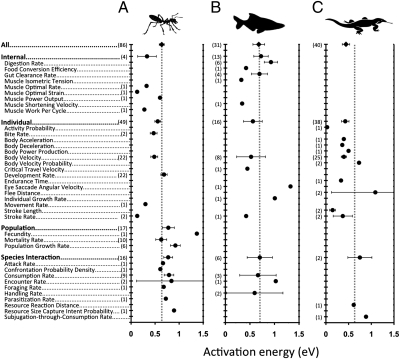
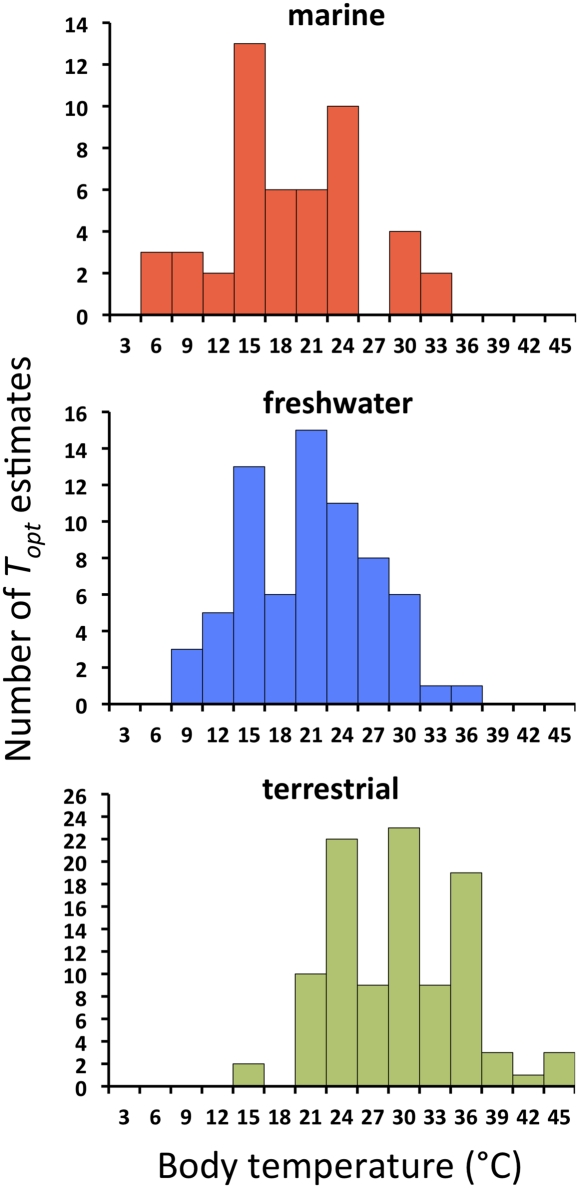
To understand the effects of temperature on biological systems, we compile, organize, and analyze a database of 1,072 thermal responses for microbes, plants, and animals. The unprecedented diversity of traits (n = 112), species (n = 309), body sizes (15 orders of magnitude), and habitats (all major biomes) in our database allows us to quantify novel features of the temperature response of biological traits. In particular, analysis of the rising component of within-species (intraspecific) responses reveals that 87% are fit well by the Boltzmann-Arrhenius model. The mean activation energy for these rises is 0.66 ± 0.05 eV, similar to the reported across-species (interspecific) value of 0.65 eV. However, systematic variation in the distribution of rise activation energies is evident, including previously unrecognized right skewness around a median of 0.55 eV. This skewness exists across levels of organization, taxa, trophic groups, and habitats, and it is partially explained by prey having increased trait performance at lower temperatures relative to predators, suggesting a thermal version of the life-dinner principle-stronger selection on running for your life than running for your dinner. For unimodal responses, habitat (marine, freshwater, and terrestrial) largely explains the mean temperature at which trait values are optimal but not variation around the mean. The distribution of activation energies for trait falls has a mean of 1.15 ± 0.39 eV (significantly higher than rises) and is also right-skewed. Our results highlight generalities and deviations in the thermal response of biological traits and help to provide a basis to predict better how biological systems, from cells to communities, respond to temperature change.


Conflict of interest statement

The authors declare no conflict of interest.

Figures

Fig. 1.
Fig. 1.
Diversity of intraspecific temperature responses analyzed in our study. Total number of thermal response data for habitat, laboratory/field, level of biological organization, and thermy of predator or prey (traits involving single species) or predator and prey (traits involving interactions between two species) (artificial taxa are shown in SI Appendix, Table S3) as well as motivation (main text) (A), trophic group (B), and taxonomic group (C). B and C sum to more than 1,072 (the total number of responses) because species interactions include multiple species. Further details on trait categories and data sources are provided in SI Appendix.
Fig. 2.
Fig. 2.
Analysis of activation energies, E, for rise responses and temperatures for optimum trait values, Topt. (A) Mean E (±95% CI) of intraspecific rise responses calculated from the Boltzmann–Arrhenius model. Responses are grouped by habitat, motivation, level of biological organization, laboratory or field measurements, taxa, and trophic group. The vertical dotted line marks 0.65 eV, as reported for interspecific studies within the MTE. (B) Relative activation energy [median (E) − mean (E)] of intraspecific rise responses bounded by the interquartile range. Symmetrical distributions have an equal mean and median, and thus a relative activation energy of zero (vertical dotted line). Most medians lie below zero, indicating right skew. (C) Mean Topt (±95% CI) of intraspecific unimodal responses. All values in parentheses are sample sizes with pseudoreplicates combined. Trait categorizations, definitions, treatment of pseudoreplicates, and data sources are provided in SI Appendix.
Fig. 3.
Fig. 3.
Histograms of intraspecific activation energies. Gray columns are the total number of rise responses, red columns are the subset of these responses that correspond to negative motivation, and green columns are the subset of these responses that correspond to positive motivation. (Insets) Examples of responses of traits corresponding to positive (green) and negative (red) motivations, respectively. OLS regressions based on the Boltzmann–Arrhenius model (Eq. 1) were fitted to the rise component of each response. Trait values are normalized relative to the maximum trait value in each data series to present multiple responses on the same scale. Values of E for insets are mean values for all negative and positive motivation traits. Escape body velocities (m/s) (negative motivation) of the northern desert iguana (light blue circle, E = 0.96 ± 0.52 eV), western fence lizard (brown triangle, E = 0.63 ± 0.28 eV), African clawed frog (dark blue diamond, E = 0.25 ± 0.06 eV), and wandering garter snake (yellow square, E = 0.36 ± 0.14 eV) are shown. Consumption rates [consumed prey/(predator * s)] (positive motivation) of river perch preying on phantom midge larvae (light blue circle, E = 0.99 ± 0.25 eV), back-swimmer preying on culex mosquito larvae (brown triangle, E = 1.09 ± 0.46 eV), dampwood termite feeding on eucalyptus tree (dark blue diamond, E = 0.65 ± 0.40 eV), and atlantic oyster drill preying on eastern oysters (yellow square, E = 1.18 ± 0.83 eV) are shown. Trait definitions, data fitting methods, and data sources are provided in SI Appendix.
Fig. 4.
Fig. 4.
Mean activation energies, E (±95% CI), of intraspecific rise responses calculated using the Boltzmann–Arrhenius model are categorized by different levels of organization for terrestrial insects (A), marine and freshwater fish (B), and terrestrial lizards (C). The vertical dotted lines mark 0.65 eV reported for interspecific studies (2, 4, 18). All values in parentheses are sample sizes with pseudoreplicates combined. Trait definitions, treatment of pseudoreplicates, and data sources are provided in SI Appendix.
Fig. 5.
Fig. 5.
Histograms of Topt categorized by habitat. The optima at 15 °C, 20 °C, 25 °C, 30 °C, and 35 °C likely represent overrepresentation of these temperatures in experimental studies. Data sources are provided in SI Appendix, Tables S3 and S6.

Comment in

References

    1. IPCC. Climate Change 2007: Synthesis Report. Contribution of Working Groups I, II and III to the Fourth Assessment Report of the Intergovernmental Panel on Climate Change. Geneva, Switzerland: IPPC; 2007.
    1. Brown JH, Gillooly JF, Allen AP, Savage VM, West GB. Toward a metabolic theory of ecology. Ecology. 2004;85:1771–1789.
    1. Angilletta MJ. Thermal adaptation: A Theoretical and Empirical Synthesis. Oxford: Oxford Univ Press; 2009.
    1. Gillooly JF, Brown JH, West GB, Savage VM, Charnov EL. Effects of size and temperature on metabolic rate. Science. 2001;293:2248–2251. - PubMed
    1. Cossins AR, Bowler K. Temperature Biology of Animals. New York: Chapman & Hall; 1987.

Publication types

LinkOut - more resources