SLCO2B1 and SLCO1B3 may determine time to progression for patients receiving androgen deprivation therapy for prostate cancer
- PMID: 21606417
- PMCID: PMC3138634
- DOI: 10.1200/JCO.2010.31.2405
SLCO2B1 and SLCO1B3 may determine time to progression for patients receiving androgen deprivation therapy for prostate cancer
Erratum in
- J Clin Oncol. 2012 Jul 10;30(20):2572
Abstract
Purpose: Androgen deprivation therapy (ADT), an important treatment for advanced prostate cancer, is highly variable in its effectiveness. We hypothesized that genetic variants of androgen transporter genes, SLCO2B1 and SLCO1B3, may determine time to progression on ADT.
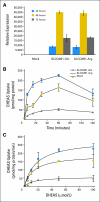
Patients and methods: A cohort of 538 patients with prostate cancer treated with ADT was genotyped for SLCO2B1 and SLCO1B3 single nucleotide polymorphisms (SNP). The biologic function of a SLCO2B1 coding SNP in transporting androgen was examined through biochemical assays.
Results: Three SNPs in SLCO2B1 were associated with time to progression (TTP) on ADT (P < .05). The differences in median TTP for each of these polymorphisms were about 10 months. The SLCO2B1 genotype, which allows more efficient import of androgen, enhances cell growth and is associated with a shorter TTP on ADT. Patients carrying both SLCO2B1 and SLCO1B3 genotypes, which import androgens more efficiently, exhibited a median 2-year shorter TTP on ADT, demonstrating a gene-gene interaction (P(interaction) = .041).
Conclusion: Genetic variants of SLCO2B1 and SLCO1B3 may function as pharmacogenomic determinants of resistance to ADT in prostate cancer.
Conflict of interest statement
Authors' disclosures of potential conflicts of interest and author contributions are found at the end of this article.
Figures


References
-
- Ross RW, Oh WK, Xie W, et al. Inherited variation in the androgen pathway is associated with the efficacy of androgen-deprivation therapy in men with prostate cancer. J Clin Oncol. 2008;26:842–847. - PubMed
-
- Ross RW, Xie W, Regan MM, et al. Efficacy of androgen deprivation therapy (ADT) in patients with advanced prostate cancer: Association between Gleason score, prostate-specific antigen level, and prior ADT exposure with duration of ADT effect. Cancer. 2008;112:1247–1253. - PubMed
-
- Feldman BJ, Feldman D. The development of androgen-independent prostate cancer. Nat Rev Cancer. 2001;1:34–45. - PubMed
-
- Nelson WG, De Marzo AM, Isaacs WB, et al. Prostate cancer. N Engl J Med. 2003;349:366–381. - PubMed
-
- Scher HI, Sawyers CL. Biology of progressive, castration-resistant prostate cancer: Directed therapies targeting the androgen-receptor signaling axis. J Clin Oncol. 2005;23:8253–8261. - PubMed
Publication types
MeSH terms
Substances
Grants and funding
LinkOut - more resources
Full Text Sources
Other Literature Sources
Medical

