. 2011 Jun 6;208(6):1215-28.
doi: 10.1084/jem.20102177. Epub 2011 May 23.

Polyubiquitin binding to ABIN1 is required to prevent autoimmunity

Affiliations

Polyubiquitin binding to ABIN1 is required to prevent autoimmunity

Sambit K Nanda et al. J Exp Med. .

Abstract

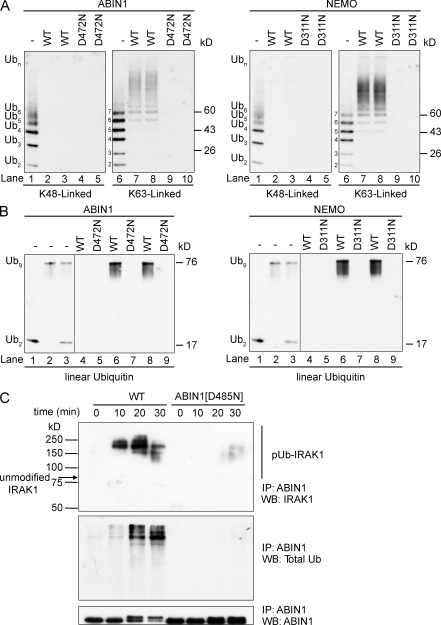
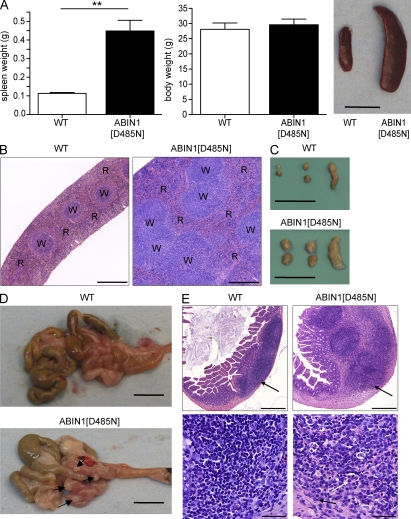
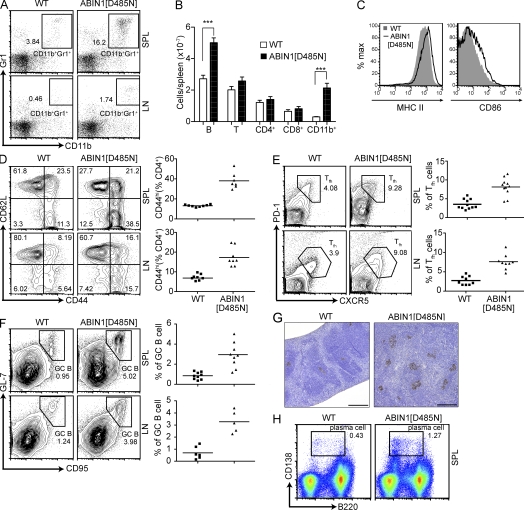
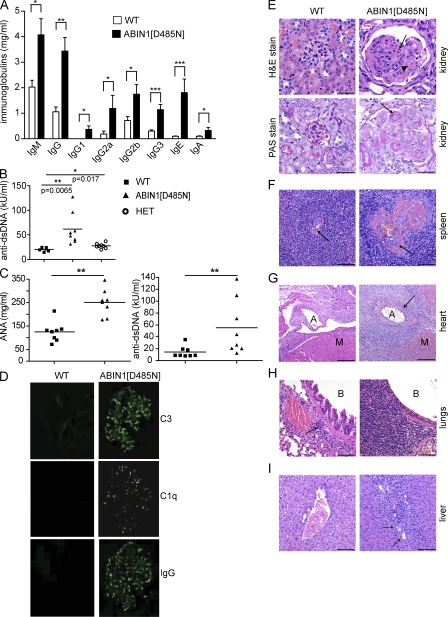
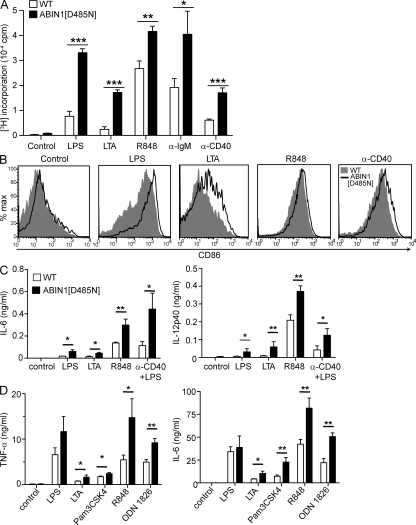
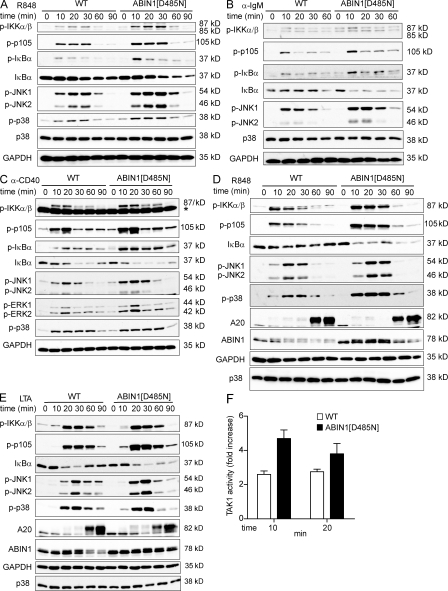
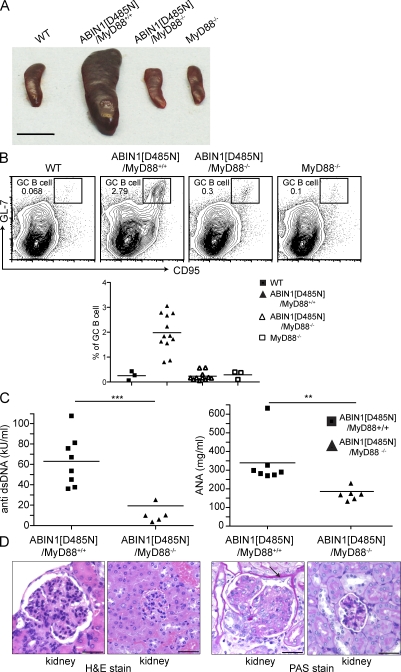
The protein ABIN1 possesses a polyubiquitin-binding domain homologous to that present in nuclear factor κB (NF-κB) essential modulator (NEMO), a component of the inhibitor of NF-κB (IκB) kinase (IKK) complex. To address the physiological significance of polyubiquitin binding, we generated knockin mice expressing the ABIN1[D485N] mutant instead of the wild-type (WT) protein. These mice developed all the hallmarks of autoimmunity, including spontaneous formation of germinal centers, isotype switching, and production of autoreactive antibodies. Autoimmunity was suppressed by crossing to MyD88(-/-) mice, demonstrating that toll-like receptor (TLR)-MyD88 signaling pathways are needed for the phenotype to develop. The B cells and myeloid cells of the ABIN1[D485N] mice showed enhanced activation of the protein kinases TAK, IKK-α/β, c-Jun N-terminal kinases, and p38α mitogen-activated protein kinase and produced more IL-6 and IL-12 than WT. The mutant B cells also proliferated more rapidly in response to TLR ligands. Our results indicate that the interaction of ABIN1 with polyubiquitin is required to limit the activation of TLR-MyD88 pathways and prevent autoimmunity.


Figures

Figure 1.
Figure 1.
Binding to Lys63-linked or linear polyubiquitin chains is disrupted by a point mutation in the UBAN of ABIN1 or NEMO. (A and B) The binding of WT and mutant human ABIN1 and NEMO to polyubiquitin chains is described in Materials and methods. Polyubiquitin chains captured by the immobilized proteins were released by denaturation in 1% (wt/vol) SDS, subjected to SDS-PAGE and immunoblotted with an anti-ubiquitin antibody (Dako). (A) Lanes 1 and 6 show, respectively, the K48-linked and K63-linked polyubiquitin preparations used in the experiment. The binding of K48-linked (lanes 2 and 3) and K63-linked (lanes 7 and 8) polyubiquitin chains to WT ABIN1 (left) or NEMO (right) and to the ABIN1[D472N] and NEMO[D311N] mutants (lanes 4, 5, 9, and 10, left and right) is shown. Similar results were obtained in two different experiments. (B) As in A, except that binding to linear polyubiquitin oligomers was studied. Lanes 1–3 show the di-ubiquitin and nona-ubiquitin preparations used in the experiment. Lane 4 shows the lack of binding to di-ubiquitin, lane 6 the binding to nona-ubiquitin, and lane 8 the selective capture of nona-ubiquitin by ABIN1 and NEMO when presented with a mixture of nona-ubiquitin and di-ubiquitin, and lanes 5, 7, and 9 the lack of binding of ABIN1[D472N] and NEMO[D311N] to linear ubiquitin oligomers. Similar results were obtained in two different experiments. Gray lines indicate that intervening lanes were spliced out. (C) BMDM from ABIN1[D485N] and WT mice were stimulated with 100 ng/ml LPS for the times indicated. ABIN1 was immunoprecipitated from the cell extracts and immunoblotted with anti-IRAK1 (top), anti-ubiquitin (middle), and anti-ABIN1 (bottom) antibodies. Similar results were obtained in two different experiments.
Figure 2.
Figure 2.
Spontaneous development of defects in multiple immune organs in ABIN1[D485N] mice. (A) Mean spleen weight (left) and body weight (middle) of WT and ABIN1[D485N] knockin mice with a typically enlarged spleen in 4-mo-old mutant mice (right). Bar, 1 cm. (B) Representative photomicrograph of hematoxylin and eosin–stained spleen sections from WT and ABIN1[D485N] mice. The red (R) and white (W) pulp are indicated. Bars, 0.05 mm. (C) Axillary, inguinal, and mesenteric LNs of 5-mo-old ABIN1[D485N] mice compared with WT mice. Bars, 1 cm. (D) Gut-associated lymphoid tissue (arrows) of the small intestine wall of ABIN1[D485N] (bottom) and WT (top) mice. Bars, 1 cm. (E) Hematoxylin and eosin–stained sections of Peyer’s patches (PP) in WT and ABIN1[D485N] mice. In the low-power view (top; bars, 0.5 mm), the arrows indicate Peyer’s patches in ABIN[D485N mice compared with WT mice. In the high-power view (bottom; bar, 0.05 mm), there are Peyer’s patches showing plasma cells (white arrows) and neutrophils (black arrow) in the ABIN1[D485N] mice. All mice used were 16–20 wk old. Data are representative of at least 12 mice (A–C) and 6 mice (D and E) of each genotype. Error bars show the mean ± SEM. **, P < 0.005 (two-tailed Students t test).
Figure 3.
Figure 3.
Defects in immune cells with spontaneous germinal center formation in ABIN1[D485N] mice. (A–F and H) Flow cytometric profiles of spleen (SPL) and LNs. Profiles were gated on: lymphocytes by FSC/SSC (C–F and H); live cells (A); TCR-β+ CD4+ (D and E), and B220+ (C and F). The numbers within figures indicate the percentages of different cells. GC B, germinal center B cell. (A) Flow cytometric dot plots of spleen (top) and LN (bottom) showing frequencies of the CD11b+ GR-1+ (macrophages and granulocytes) population in ABIN1[D485N] and WT mice. (B) Total cell numbers in spleens of ABIN1[D485N] mice compared with WT. Error bars show the mean ± SEM. ***, P < 0.001 (two-tailed Students t test). (C) Expression of B cell activation markers from WT (shaded area) and ABIN1[D485N] (black line). (D–F) Contour plots (left) and graphical analysis (right) showing percentages of cell populations in spleen (top) and LN (bottom). Each symbol represents one mouse and the horizontal bars show the mean of the values obtained. (D) Activated (CD4+ CD44hi CD62Llo) and naive (CD4+ CD62Lhi) T cells. (E) Tfh cells (CD4+ CXCR5+ PD-1 hi). (F) Germinal center B cells (B220+ GL-7+ CD95+). (G) Immunohistochemistry of spleens from 16-wk-old mice with germinal centers (brown) stained with peanut agglutinin (PNA). Bars, 0.5 mm. (H) Expression of CD138 and B220 in spleen showing plasma cells in ABIN1[D485N] mice and WT mice. All mice analyzed were 12–16 wk old, and data are representative of at least three independent experiments with three to four mice of each genotype (A-F and H) or single experiment with six mice per genotype (G).
Figure 4.
Figure 4.
Autoimmune phenotypes in ABIN1[D485N] mice. Values were compared by the Mann-Whitney U test. *, P ≤ 0.05; **, P ≥ 0.005; ***, P ≤ 0.005. (A) Serum levels of immunoglobulin isotypes quantitated by ELISA in WT and ABIN1[D485N] mice. Error bars represent mean ± SEM. (B) Level of anti-dsDNA antibodies in serum of 16-wk-old WT, ABIN1[D485N], and heterozygous (HET) mice measured by ELISA. (C) Total antinuclear antibodies (ANA; left) and anti-dsDNA antibodies (right) in the serum of 22-wk-old WT and ABIN1[D485N] mice were measured by ELISA. (B and C) Each symbol represents one mouse and the horizontal bars show the mean of the values obtained. (D) Kidney sections stained with fluorescein isothiocyanate–labeled anti–mouse C3, C1q, and IgG. (E) Kidney sections stained with hematoxylin and eosin (top) or PAS (bottom). Bar, 0.05 mm. In the top panel, the arrowhead shows glomerulonephritis with capillary loop thickening by eosinophilic material and the black arrow shows infiltration of mesangium by neutrophils. In the bottom panel, the arrow shows glomerulonephritis, with capillary wall thickening by PAS-positive staining. (F–I) Hematoxylin and eosin–stained sections of spleen, heart, lungs, and liver. (F) Spleen. The arrow indicates the WT (left) or congested splenic artery in ABIN1[D485N] mice (right) by eosinophilic material. Bars, 0.1 mm. (G) Heart. The arrow indicates infiltration of neutrophils and macrophages around arterial wall (A) in ABIN1[D485N] mice. M, myocardium. Bars, 0.2 mm. (H) Lungs. The arrows show plasma cells in the WT and ABIN1[D485N] mice. B, bronchus. Bars, 0.1 mm. (I) Liver, the portal tracts are shown by arrows. Bars, 0.1 mm. The data are from a single experiment with 7–9 (A–C) or 6–12 (D–I) mice per genotype.
Figure 5.
Figure 5.
Enhanced activation of B cells and myeloid cells in ABIN1[D485N] mice. (A) Naive purified splenic B cells from WT and ABIN1[D485N] mice were stimulated with 200 ng/ml LPS, 10 µg/ml LTA, 200 ng/ml of the TLR7 agonist R848, 10 µg/ml α-IgM, or 1 µg/ml α-CD40 for 72 h or left unstimulated (control) before pulsing for a further 16 h with [3H]thymidine (0.5 µCi/well). [3H]thymidine incorporation into DNA was measured by harvesting and washing the cells followed by measurement of radioactivity incorporated. (B) Flow cytometric analysis of surface expression of the activation marker CD86 after stimulation of purified B cells with the agonists indicated. The filled histograms show results for WT cells and the empty histograms show the ABIN1[D485N] cells. (C) IL-6 and IL-12p40 secreted into the culture medium of B cells 48 h after exposure to the agonists indicated. (D) IL-6 and TNF secreted into the culture medium of BMDC 24 h after exposure to 100 ng/ml LPS, 2 µg/ml LTA, 1 µg/ml Pam3CSK4, 1 µg/ml R848, or 1 µM of the TLR9 agonist ODN 1826. Data are representative of five (A) or three (B–D) independent experiments with three to four mice of each genotype analyzed together. Error bars represent mean ± SD. *, P ≤ 0.05; **, P ≥ 0.005; ***, P ≤ 0.005 (two-tailed Student’s t test).
Figure 6.
Figure 6.
Activation of signaling pathways in B cells and BMDC from WT and ABIN1[D485N] mice. (A–C) B cells from WT and ABIN1[D485N] mice were stimulated with 0.5 µg/ml of the TLR7 agonist R848 (A), 10 µg/ml α-IgM (B), or 10 µg/ml α-CD40 (C) for the times indicated, and cell lysates were probed with the antibodies indicated. *, nonspecific band. Antibodies that recognize GAPDH and p38 MAPK served as loading controls. The α-phospho (p)–IKK-α/β antibody in C–E (Ser176/180, antibody 16A6; Cell Signaling Technologies) differed from that used in A and B (Ser180/181; Cell Signaling Technologies). (D and E) BMDC from WT and ABIN1[D485N] mice were stimulated with 0.25 µg/ml of the TLR7 agonist R848 (D) or 2 µg/ml of the TLR2/6 agonist LTA (E) for the times indicated, and cell lysates were probed with the antibodies indicated. (A–E) The data are representative of two to four independent experiments. (F) BMDC were stimulated with 0.5 µg/ml R848 for the times indicated and lysed, and TAK1 was immunoprecipitated with α-TAK1 and assayed as described in Materials and methods. The activity is plotted as fold increase compared with that measured in the lysates from cells not been stimulated with R848. The results are average data from three different experiments, each with BMDC from different mice, with each sample being assayed in duplicate. Error bars represent mean ± SEM.
Figure 7.
Figure 7.
Comparison of the phenotypes of WT, ABIN1[D485N], ABIN1[D485N]/MyD88−/−, and MyD88−/− mice. (A) Spleen sizes of WT, ABIN1[D485N]xMyD88+/+, ABIN1[D485N]xMyD88−/−, and MyD88−/− mice. Bar, 1 cm. A typical result from many mice analyzed is shown. (B) Flow cytometric analysis was performed as in Fig 2, and a representative set of contour plots is presented (top) showing the proportion of germinal center (GC) B cells (B220+ GL-7+ CD95+) in WT, ABIN1[D485N]xMyD88+/+, ABIN1[D485N]xMyD88−/−, and MyD88−/− mice. Similar results were obtained in three independent experiments. On the bottom, the percentage of GC B cells is shown for each WT type (filled squares), ABIN1[D485N]xMyD88+/+ (filled triangles), ABIN1[D485N]xMyD88−/− (open triangles), and MyD88−/− (open squares) mouse examined. Each symbol represents an individual mouse and the horizontal bar shows the mean of the values obtained. (C) Anti-dsDNA antibodies and ANA antibodies in ABIN1[D485N]xMyD88+/+ mice (filled squares) and ABIN1[D485N]xMyD88−/− mice (filled triangles). Data are shown for a single experiment with six to eight mice of each genotype. ***, P < 0.005; **, P > 0.005 (Mann-Whitney U test). Each symbol represents an individual mouse and the horizontal bar shows the mean of the values obtained. (D) Hematoxylin and eosin (H&E) staining (first two panels) and PAS staining (third and fourth panels) of kidney sections from ABIN1[D485N]xMyD88+/+ and ABIN1[D485N]xMyD88−/−. Bars, 0.05 mm. The arrow shows PAS-positive material. Three or four mice of each genotype were analyzed and a representative result is shown.

References

    1. Banchereau J., Pascual V. 2006. Type I interferon in systemic lupus erythematosus and other autoimmune diseases. Immunity. 25:383–392 10.1016/j.immuni.2006.08.010 - DOI - PubMed
    1. Bessa J., Kopf M., Bachmann M.F. 2010. Cutting edge: IL-21 and TLR signaling regulate germinal center responses in a B cell-intrinsic manner. J. Immunol. 184:4615–4619 10.4049/jimmunol.0903949 - DOI - PubMed
    1. Boone D.L., Turer E.E., Lee E.G., Ahmad R.C., Wheeler M.T., Tsui C., Hurley P., Chien M., Chai S., Hitotsumatsu O., et al. 2004. The ubiquitin-modifying enzyme A20 is required for termination of Toll-like receptor responses. Nat. Immunol. 5:1052–1060 10.1038/ni1110 - DOI - PubMed
    1. Cheung P.C., Campbell D.G., Nebreda A.R., Cohen P. 2003. Feedback control of the protein kinase TAK1 by SAPK2a/p38alpha. EMBO J. 22:5793–5805 10.1093/emboj/cdg552 - DOI - PMC - PubMed
    1. Chu Y., Vahl J.C., Kumar D., Heger K., Bertossi A., Wójtowicz E., Soberon V., Schenten D., Mack B., Reutelshöfer M., et al. 2011. B cells lacking the tumor suppressor TNFAIP3/A20 display impaired differentiation and hyperactivation and cause inflammation and autoimmunity in aged mice. Blood. 117:2227–2236 10.1182/blood-2010-09-306019 - DOI - PubMed

Publication types