. 2012 Jan;17(1):71-84.
doi: 10.1038/mp.2011.57. Epub 2011 May 24.

SHANK3 mutations identified in autism lead to modification of dendritic spine morphology via an actin-dependent mechanism

Affiliations
Free PMC article

SHANK3 mutations identified in autism lead to modification of dendritic spine morphology via an actin-dependent mechanism

C M Durand et al. Mol Psychiatry. 2012 Jan.
Free PMC article

Abstract

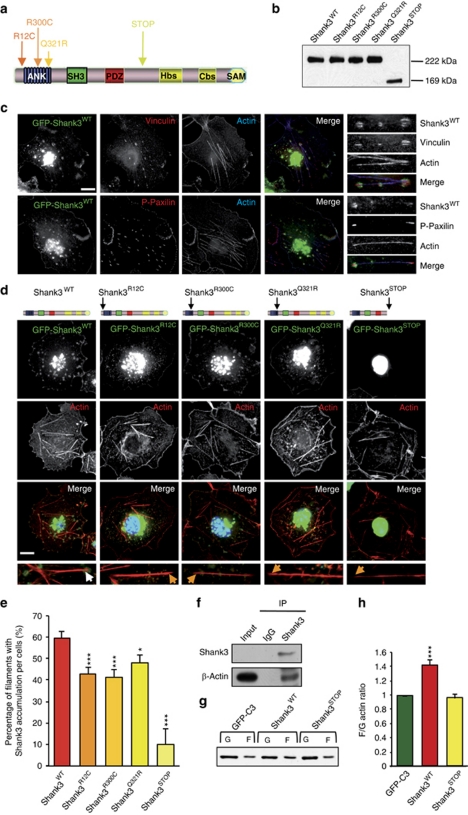
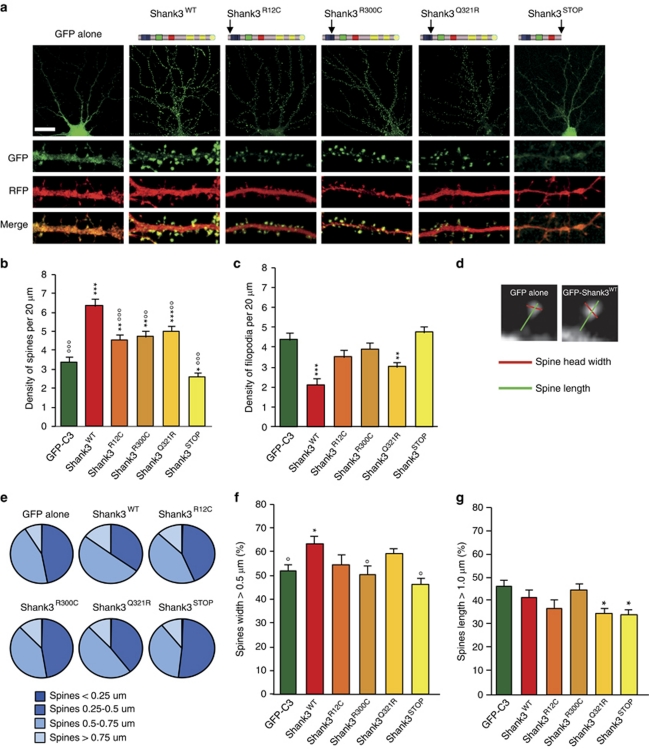
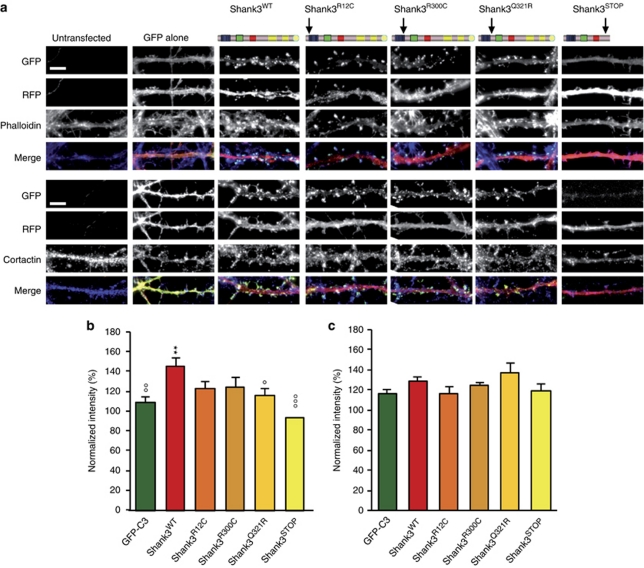
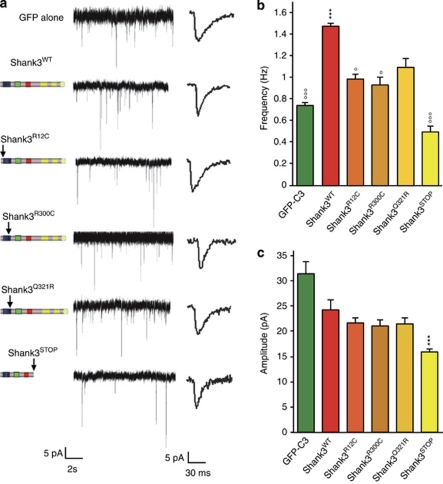
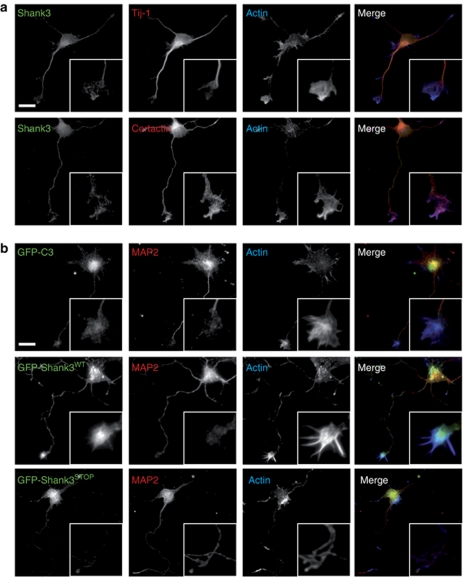
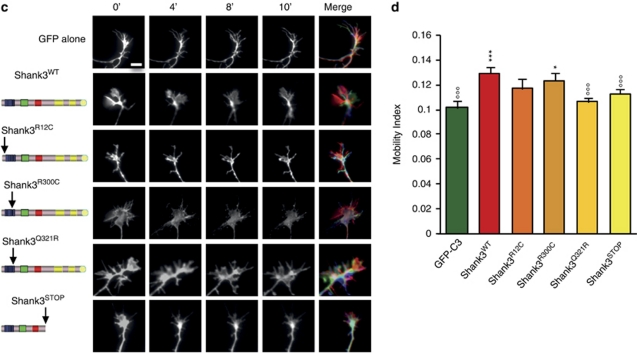
Genetic mutations of SHANK3 have been reported in patients with intellectual disability, autism spectrum disorder (ASD) and schizophrenia. At the synapse, Shank3/ProSAP2 is a scaffolding protein that connects glutamate receptors to the actin cytoskeleton via a chain of intermediary elements. Although genetic studies have repeatedly confirmed the association of SHANK3 mutations with susceptibility to psychiatric disorders, very little is known about the neuronal consequences of these mutations. Here, we report the functional effects of two de novo mutations (STOP and Q321R) and two inherited variations (R12C and R300C) identified in patients with ASD. We show that Shank3 is located at the tip of actin filaments and enhances its polymerization. Shank3 also participates in growth cone motility in developing neurons. The truncating mutation (STOP) strongly affects the development and morphology of dendritic spines, reduces synaptic transmission in mature neurons and also inhibits the effect of Shank3 on growth cone motility. The de novo mutation in the ankyrin domain (Q321R) modifies the roles of Shank3 in spine induction and morphology, and actin accumulation in spines and affects growth cone motility. Finally, the two inherited mutations (R12C and R300C) have intermediate effects on spine density and synaptic transmission. Therefore, although inherited by healthy parents, the functional effects of these mutations strongly suggest that they could represent risk factors for ASD. Altogether, these data provide new insights into the synaptic alterations caused by SHANK3 mutations in humans and provide a robust cellular readout for the development of knowledge-based therapies.


Figures

Figure 1
Figure 1
Mutations in Shank3 affect its recruitment to the tips of actin filaments and actin polymerization. (a) Localization of rare non-synonymous variations or truncating SHANK3 mutations identified in autism spectrum disorder., ANK, ankyrin repeats; Cbs, cortactin-binding site; Hbs, Homer-binding site; PDZ, postsynaptic density 95/discs large/zona occludens-1 homology domain; SAM, sterile alpha motif domain; SH3, Src homology 3 domain. (b) Western blot analysis of the green fluorescent protein (GFP) constructs expressed in HEK293T cells. We observed similar sizes of Shank3WT and fusion proteins carrying point mutations (Shank3R12C, Shank3R300C and Shank3Q321R). The frameshift mutation results in a truncated protein (222 kDa GFP–Shank3WT and 169 kDa GFP–Shank3STOP). (c) Localization of Shank3WT in COS-7 cells transiently transfected with GFP–Shank3WT (green) and labeled with phalloidin 647 to visualize F-actin (blue) and with anti-vinculin or anti-phospho-paxillin (red), two focal adhesion proteins. Shank3WT is located at the membrane and in intracellular clusters that colocalize with vinculin or phospho-paxillin at the tips of actin filaments. On the right side, magnification of representative stress fibers with clusters of Shank3WT. (d) Localization of Shank3WT and mutated forms in COS-7 cells. COS-7 cells transiently transfected with GFP–Shank3WT or mutated forms (green), and labeled with phalloidin 546 to visualize F-actin (red) and 4′,6-diamidino-2-phenylindole to visualize the nucleus (blue). Shank3R12C, Shank3R300C and Shank3Q321R are located at the membrane and in intracellular clusters. Conversely, Shank3STOP is restricted to around the nucleus. (e) Quantification of the accumulation of GFP constructs at the tips of actin filaments. Percentage of filaments with Shank3 clusters per cell (%). This accumulation is significantly reduced with mutated Shank3 and absent with Shank3STOP (n=30–40 cells). Scale bars represent 15 μm. (f) Coimmunoprecipitation of Shank3 and actin in an adult rat brain. Lysate (input) was incubated with control immunoglobulin or anti-Shank3. Immunoprecipitation was performed, followed by western blotting using anti-β-actin. (g) Shank3STOP inhibits the effect of Shank3WT on actin polymerization. HEK293T were transiently co-transfected with red fluorescent protein–actin and GFP–C3 (control), GFP–Shank3WT or GFP–Shank3STOP. Representative immunoblots of G-actin (G) and F-actin (F) fractions obtained with an Actin Polymerization Assay kit. G-actin and F-actin were probed with anti-actin antibody. (h) Ratio of F-actin/G-actin was measured for each condition. The ratio is normalized to GFP–C3 and is represented as the mean±s.e.m. Shank3WT enhances the polymerization of actin (***P<0.001; n=6 independent experiments). Shank3STOP inhibits the effect of Shank3 on actin polymerization.
Figure 2
Figure 2
Effect of Shank3WT and mutants on dendritic spine induction and maturation. (a) Hippocampal neurons were transiently co-transfected with green fluorescent protein (GFP)–Shank3WT or mutated forms (green) and red fluorescent protein (red) and processed for immunofluorescence after 4 days (days in vitro 21, DIV21), and the subcellular localization of each construct was analyzed. Neurons are stained with anti-GFP (green) and anti-DsRED (red). Scale bars represent 20 μm. On the bottom side, magnification of 20 μm of the dendrite transfected with each construct. (b) Comparison of spine density in neurons transfected with the different Shank3 constructs (number of spines per 20 μm of dendrite length) in co-transfected neurons. (c) Comparison of the density of filopodia (number of filopodia per 20 μm of dendrite length) in co-transfected neurons. Shank3WT leads to an increase in the number of spines and a decrease in the number of filopodia. All mutations reduce the ability of Shank3 to induce spines. (***P<0.001 and **P<0.01 compared with the control; °°°P<0.001, °°P<0.01 and °P<0.05 compared with Shank3WT). (d) Examples of spines from neurons transfected with GFP–C3 or GFP–Shank3WT. Spine length (green line) and head width (red line) were computed using Volocity software. (e) Truncating mutation causes a decrease in the number of larger spines and an increase in the number of thin spines. Relative abundance of four different spine classes according to spine-head size (0–0.25; 0.25–0.5; 0.5–0.75; and >0.75 μm). (f) Percentage of spine heads >0.5 μm within the same population. Spine heads are significantly larger in GFP–Shank3WT- and GFP–Shank3Q321R-transfected neurons compared with the control (*P<0.05). Spine heads are significantly smaller in GFP–Shank3STOP. (g) Percentage of spines >1.0 μm within the same population. Spine length is significantly reduced with GFP–Shank3Q321R and GFP–Shank3STOP constructs compared with the control (*P<0.05; n=17–28 neurons and 1500–1800 spines).
Figure 3
Figure 3
Effects of Shank3WT and mutants on F-actin and cortactin levels in spines. (a) Immunofluorescence microscopy of hippocampal neurons at DIV21 transiently co-transfected with green fluorescent protein (GFP)–Shank3WT or mutated forms and red fluorescent protein. Neurons are stained with anti-GFP and anti-DsRED. F-actin was visualized with phalloidin 647. Cortactin is visualized with anti-cortactin (blue). Scale bars represent 6 μm. (b, c) Quantification of changes in the synaptic staining intensity of F-actin or cortactin induced by the overexpression of Shank3WT or the mutated forms. (**P<0.01 compared with the control; °°°P<0.001, °°P<0.01 and °P<0.05 compared with Shank3WT).
Figure 4
Figure 4
The Shank3 mutations decreased spontaneous neuronal activity. (a) Miniature EPSCs (mEPSCs) recorded at −60 mV on hippocampal neurons (DIV21) transiently co-transfected with green fluorescent protein (GFP)–C3, GFP–Shank3WT or mutated forms. (b) Quantification of mEPSCs frequency and (c) amplitude under different transfection conditions. In Shank3WT, there is a significant increase in mEPSC frequency. Each bar of the histogram is the mean±s.e.m. of 10 experiments. ***P<0.001 compared with control; °°°P<0.001 and °P<0.05 compared with Shank3WT.
Figure 5
Figure 5
Effects of Shank3WT and mutants on growth cone dynamics. (a) Shank3 is found in the growth cone of neonatal rat-cultured hippocampal neurons on DIV2. Neurons are labeled for Shank3 (green), F-actin (phalloidin; blue) and either tubulin (anti-Tuj1; red) or cortactin (anti-cortactin, red). Scale bars represent 20 μm. Insets represent high magnifications of the axonal growth cone. Shank3 colocalized with F-actin (blue) and with cortactin (red) in axonal growth cones. (b) Localization of Shank3 overexpressed in young neurons. Green fluorescent protein (GFP)–Shank3WT or Shank3STOP or GFP–C3 (green) was transfected in young neurons (DIV0). Immunostaining for MAP2 (red) and actin (phalloidin; blue) revealed that Shank3WT accumulates in growth cones, whereas Shank3STOP is restricted to the cell body. (c) Time-lapse video microscopy of growth cones from rat hippocampal neurons co-transfected with the control (GFP–C3) and Shank3WT or mutated forms. Merge represents three frames with different colors (0 min in green, 5 min in red and 10 min in blue). Scale bars represent 5 μm. (d) Quantification of growth cone motility with the motility index. ***P<0.001 and *P<0.05 compared with the control; °°°P<0.001 compared with Shank3WT.
Figure 5
Figure 5
Effects of Shank3WT and mutants on growth cone dynamics. (a) Shank3 is found in the growth cone of neonatal rat-cultured hippocampal neurons on DIV2. Neurons are labeled for Shank3 (green), F-actin (phalloidin; blue) and either tubulin (anti-Tuj1; red) or cortactin (anti-cortactin, red). Scale bars represent 20 μm. Insets represent high magnifications of the axonal growth cone. Shank3 colocalized with F-actin (blue) and with cortactin (red) in axonal growth cones. (b) Localization of Shank3 overexpressed in young neurons. Green fluorescent protein (GFP)–Shank3WT or Shank3STOP or GFP–C3 (green) was transfected in young neurons (DIV0). Immunostaining for MAP2 (red) and actin (phalloidin; blue) revealed that Shank3WT accumulates in growth cones, whereas Shank3STOP is restricted to the cell body. (c) Time-lapse video microscopy of growth cones from rat hippocampal neurons co-transfected with the control (GFP–C3) and Shank3WT or mutated forms. Merge represents three frames with different colors (0 min in green, 5 min in red and 10 min in blue). Scale bars represent 5 μm. (d) Quantification of growth cone motility with the motility index. ***P<0.001 and *P<0.05 compared with the control; °°°P<0.001 compared with Shank3WT.

References

    1. Chakrabarti S, Fombonne E. Pervasive developmental disorders in preschool children: confirmation of high prevalence. Am J Psychiatry. 2005;162:1133–1141. - PubMed
    1. Newschaffer CJ, Croen LA, Daniels J, Giarelli E, Grether JK, Levy SE, et al. The epidemiology of autism spectrum disorders. Annu Rev Public Health. 2007;28:235–258. - PubMed
    1. Baird G, Simonoff E, Pickles A, Chandler S, Loucas T, Meldrum D, et al. Prevalence of disorders of the autism spectrum in a population cohort of children in South Thames: the Special Needs and Autism Project (SNAP) Lancet. 2006;368:210–215. - PubMed
    1. Toro R, Konyukh M, Delorme R, Leblond C, Chaste P, Fauchereau F, et al. Key role for gene dosage and synaptic homeostasis in autism spectrum disorders. Trends Genet. 2010;26:363–372. - PubMed
    1. Bonaglia MC, Giorda R, Borgatti R, Felisari G, Gagliardi C, Selicorni A, et al. Disruption of the ProSAP2 gene in a t(12;22)(q24.1;q13.3) is associated with the 22q13.3 deletion syndrome. Am J Hum Genet. 2001;69:261–268. - PMC - PubMed

Publication types

MeSH terms