Reproducibility analysis of diffusion tensor indices and fiber architecture of human calf muscles in vivo at 1.5 Tesla in neutral and plantarflexed ankle positions at rest
- PMID: 21608064
- PMCID: PMC3121919
- DOI: 10.1002/jmri.22596
Reproducibility analysis of diffusion tensor indices and fiber architecture of human calf muscles in vivo at 1.5 Tesla in neutral and plantarflexed ankle positions at rest
Abstract
Purpose: To investigate the reproducibility of diffusion tensor imaging (DTI) -derived indices and fiber architecture of calf muscles at 1.5 Tesla (T), to establish an imaging based method to confirm ankle position, and to compare fiber architecture at different ankle positions.
Materials and methods: Six subjects were imaged at 1.5T with the foot in neutral and plantarflexed positions. DTI indices were calculated in four muscle compartments (medial and lateral gastrocnemius [MG, LG], superficial and deep anterior tibialis [AT-S, AT-D]). Two subjects were scanned on 3 days to calculate the coefficient of variability (CV) and the repeatability coefficient (RC).
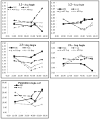
Results: DTI indices were close to the values obtained in earlier 3T and 1.5T studies. Fractional anisotropy decreased significantly in the MG and increased significantly in the AT-S and AT-D compartments while fiber orientation with respect to the magnet Z-axis increased significantly in the MG and decreased significantly in the AT-S compartment with plantarflexion. The CV and RC for the DTI indices and fiber orientations were comparable to 3T studies. Fiber lengths and orientation angles in the MG matched corresponding measures from ultrasound studies.
Conclusion: DTI at 1.5T provides reproducible measures of diffusion indices and fiber architecture of calf muscle at different muscle lengths.
Copyright © 2011 Wiley-Liss, Inc.
Figures


Similar articles
-
Age-related differences in diffusion tensor indices and fiber architecture in the medial and lateral gastrocnemius.J Magn Reson Imaging. 2015 Apr;41(4):941-53. doi: 10.1002/jmri.24641. Epub 2014 Apr 28. J Magn Reson Imaging. 2015. PMID: 24771672 Free PMC article.
-
Human soleus muscle architecture at different ankle joint angles from magnetic resonance diffusion tensor imaging.J Appl Physiol (1985). 2011 Mar;110(3):807-19. doi: 10.1152/japplphysiol.00923.2010. Epub 2010 Dec 16. J Appl Physiol (1985). 2011. PMID: 21164150 Free PMC article.
-
In vivo diffusion tensor imaging of the human calf muscle.J Magn Reson Imaging. 2006 Jul;24(1):182-90. doi: 10.1002/jmri.20593. J Magn Reson Imaging. 2006. PMID: 16729262
-
Increased muscle fiber fractional anisotropy value using diffusion tensor imaging after compression without fiber injury.Acta Radiol. 2023 Jan;64(1):139-146. doi: 10.1177/02841851211058282. Epub 2021 Dec 2. Acta Radiol. 2023. PMID: 34854736 Review.
-
A handbook for beginners in skeletal muscle diffusion tensor imaging: physical basis and technical adjustments.Eur Radiol. 2022 Nov;32(11):7623-7631. doi: 10.1007/s00330-022-08837-w. Epub 2022 May 12. Eur Radiol. 2022. PMID: 35554647 Review.
Cited by
-
Heterogeneity of muscle fat infiltration in children with spina bifida.Res Dev Disabil. 2014 Jan;35(1):215-22. doi: 10.1016/j.ridd.2013.10.002. Epub 2013 Oct 26. Res Dev Disabil. 2014. PMID: 24169376 Free PMC article. Clinical Trial.
-
Dynamic diffusion-tensor measurements in muscle tissue using the single-line multiple-echo diffusion-tensor acquisition technique at 3T.NMR Biomed. 2015 Jun;28(6):667-78. doi: 10.1002/nbm.3296. Epub 2015 Apr 22. NMR Biomed. 2015. PMID: 25900166 Free PMC article.
-
Time-dependent diffusion in skeletal muscle with the random permeable barrier model (RPBM): application to normal controls and chronic exertional compartment syndrome patients.NMR Biomed. 2014 May;27(5):519-28. doi: 10.1002/nbm.3087. Epub 2014 Mar 9. NMR Biomed. 2014. PMID: 24610770 Free PMC article. Clinical Trial.
-
Assessment of diffusion tensor imaging indices in calf muscles following postural change from standing to supine position.MAGMA. 2014 Oct;27(5):387-95. doi: 10.1007/s10334-013-0424-1. Epub 2013 Dec 3. MAGMA. 2014. PMID: 24297370
-
Polynomial fitting of DT-MRI fiber tracts allows accurate estimation of muscle architectural parameters.Magn Reson Imaging. 2012 Jun;30(5):589-600. doi: 10.1016/j.mri.2012.02.003. Epub 2012 Apr 12. Magn Reson Imaging. 2012. PMID: 22503094 Free PMC article.
References
-
- Budzik JF, Le Thuc V, Demondion X, Morel M, Chechin D, Cotten A. In vivo MR tractography of thigh muscles using diffusion imaging: initial results. Eur Radiol. 2007;17:3079–3085. - PubMed
-
- Damon BM, Ding Z, Anderson AW, Freyer AS, Gore JC. Validation of diffusion tensor MRI based muscle fiber tracking. Magn Reson Med. 2002;48:97–104. - PubMed
-
- Galbán CJ, Maderwald S, Uffmann K, Ladd ME. A diffusion tensor imaging analysis of gender differences in water diffusivity within human skeletal muscle. NMR Biomed. 2005;18:489–498. - PubMed
-
- Galbán CJ, Maderwald S, Uffmann K, de Greiff A, Ladd ME. Diffusive sensitivity to muscle architecture: a magnetic resonance diffusion tensor imaging study of the human calf. Eur J Appl Physiol. 2004;93:253–262. - PubMed
Publication types
MeSH terms
Grants and funding
LinkOut - more resources
Full Text Sources
Medical
Research Materials

