. 2011 Aug 1;57(3):938-49.
doi: 10.1016/j.neuroimage.2011.05.021. Epub 2011 May 14.

Co-activation patterns distinguish cortical modules, their connectivity and functional differentiation

Affiliations

Co-activation patterns distinguish cortical modules, their connectivity and functional differentiation

Simon B Eickhoff et al. Neuroimage. .

Abstract

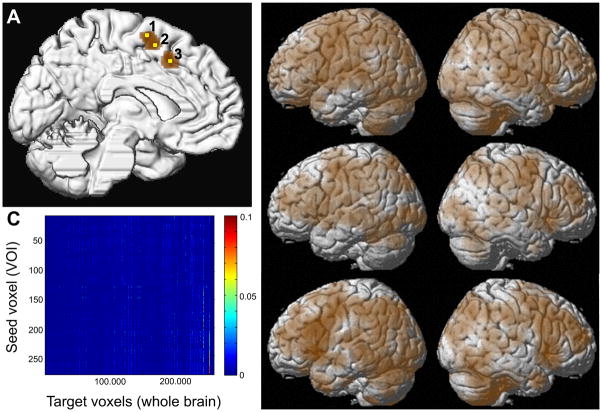
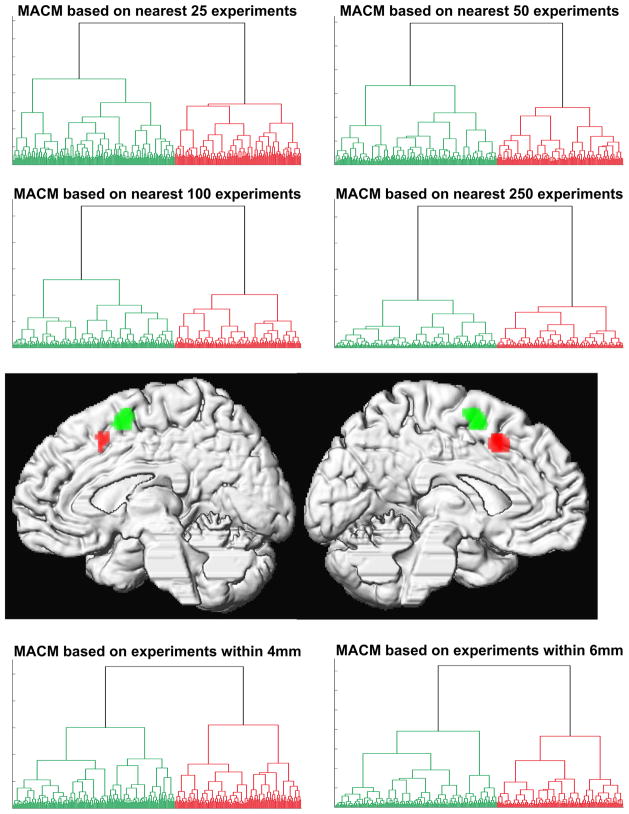
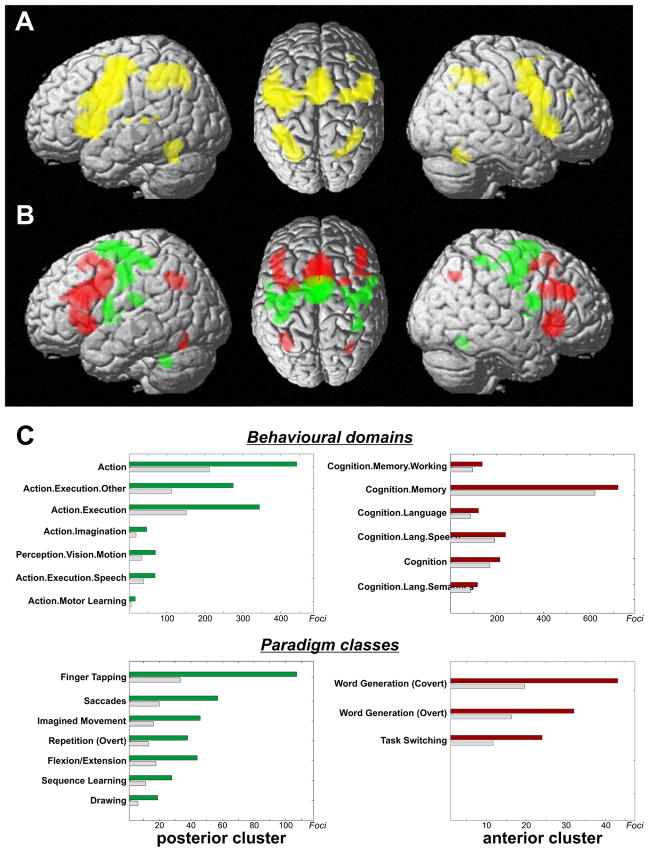
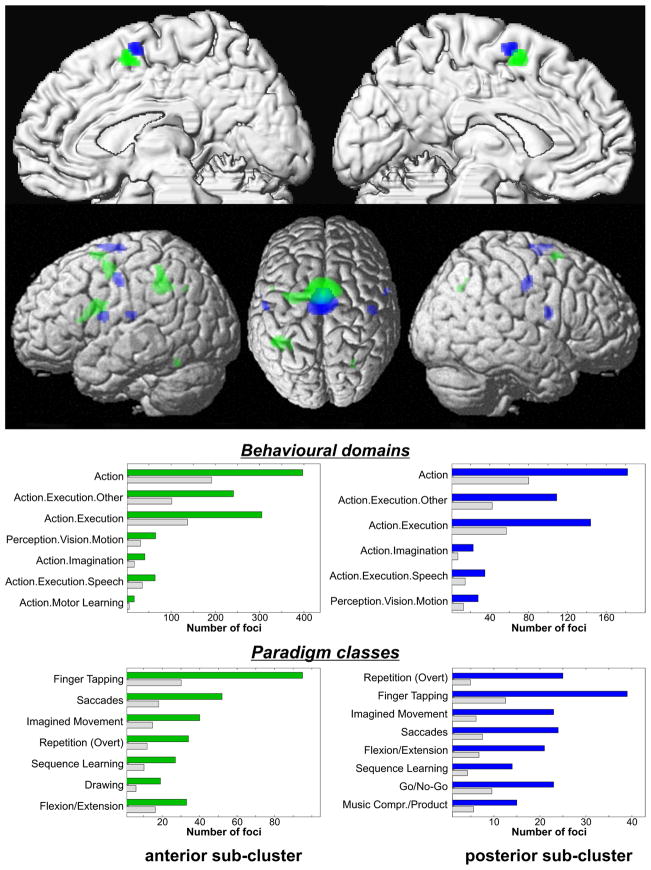
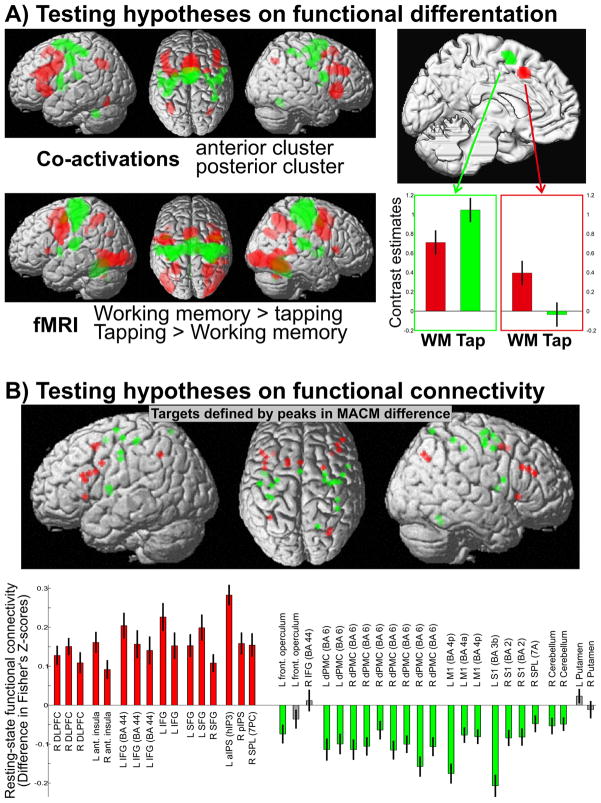
The organization of the cerebral cortex into distinct modules may be described along several dimensions, most importantly, structure, connectivity and function. Identification of cortical modules by differences in whole-brain connectivity profiles derived from diffusion tensor imaging or resting state correlations has already been shown. These approaches, however, carry no task-related information. Hence, inference on the functional relevance of the ensuing parcellation remains tentative. Here, we demonstrate, that Meta-Analytic Connectivity Modeling (MACM) allows the delineation of cortical modules based on their whole-brain co-activation pattern across databased neuroimaging results. Using a model free approach, two regions of the medial pre-motor cortex, SMA and pre-SMA were differentiated solely based on their functional connectivity. Assessing the behavioral domain and paradigm class meta-data of the experiments associated with the clusters derived from the co-activation based parcellation moreover allows the identification of their functional characteristics. The ensuing hypotheses about functional differentiation and distinct functional connectivity between pre-SMA and SMA were then explicitly tested and confirmed in independent datasets using functional and resting state fMRI. Co-activation based parcellation thus provides a new perspective for identifying modules of functional connectivity and linking them to functional properties, hereby generating new and subsequently testable hypotheses about the organization of cortical modules.


Figures

Figure 1
Figure 1
(A) Location of the seed VOI (brown) and the three exemplary voxels for which co-activation maps are illustrated, displayed on a surface rendering of the MNI single subject template. The yellow colored exemplary seed voxel 1 is located at −4/−6/+68, seed voxel 2 is located at −2/0/+60, and seed voxel 3 at −6/+12/+48 (all coordinates in MNI space). (B) Brain-wide co-activation maps of three voxels indicated by the yellow numbers in panel A as revealed by meta-analytical connectivity modelling using ALE meta-analysis on the brain-wide foci reported in those 50 experiments in BrainMap that featured the closest activation peaks to the respective seed voxels. (C) Co-activation matrix summarising the co-activation likelihood (ALE values) of all seed voxels to the rest of the grey matter. The grey matter mask is based on at least 10% probability according to the ICBM (International Consortium on Brain Mapping). This matrix containing the brain wide co-activation pattern of each individual seed voxel served as the basis for co-activation based parcellation of the medial premotor seed region.
Figure 2
Figure 2
Hierarchical cluster analysis of the co-activation profile matrix (cf. Fig. 1C) revealed a highly reliable separation of the seed voxels into two distinct clusters independent of filter criterion and cluster parameters (cf. supp. figures 2–4). Projecting the voxels back onto their brain location revealed that these clusters were spatially continuous and corresponded to an anterior and posterior cluster in the medial premotor cortex (cf. supp. figure 1)
Figure 3
Figure 3
(A) Conjunction analysis over the MACM maps for the two main clusters indicates that several fronto-parietal regions show significant co-activation with both medial premotor regions. (B) Contrasting the MACM maps revealed that the anterior cluster showed significantly higher co-activation probabilities with ventral premotor, inferior frontal and posterior parietal cortices. The posterior cluster showed significantly higher co-activation probabilities with dorsal premotor cortex, primary sensory-motor cortices, cerebellum and basal ganglia. It should be noted that, at the given threshold, many brain regions appear both in the conjunction as well as the contrast analysis. This indicates voxels, which show functional connectivity with both clusters, which, however, was significantly stronger for one of them. That is, the MACM maps of both clusters differ mainly quantitatively, i.e., connectivity likelihood between cluster and target voxels. (C) Functional characterisation by behavioural domain and paradigm class metadata. The red/green bars denote the number of foci for that particular behavioural domain/paradigm class within the anterior/posterior cluster. The grey bars represent the number of foci that would be expected to hit the particular cluster if all foci with the respective behavioural domain or paradigm class were randomly distributed throughout the cerebral cortex. That is, the grey bars denote the by-chance frequency of that particular label given the size of the cluster. This analysis indicated that the posterior cluster was strongly related to motor functions whereas the anterior cluster showed lower specificity but was activated predominantly by more cognitive processes, such as language, working memory, and task switching.
Figure 4
Figure 4
MACM maps and functional characterisation of the two sub-clusters jointed at the second-to-last linkage. As indicated by the top panel, the posterior sub-cluster showed higher probability for co-activation with primary sensory-motor and inferior frontal cortices, the anterior one co-activated stronger with premotor cortex, left BA 44 and the inferior parietal lobule. In the lower panel, the assessment of BD and PC profiles for experiments activating either region indicated that overrepresented BDs and PCs were very similar. Again, the blue/light green bars denote the number of foci for that particular behavioural domain/paradigm class within the two sub-clusters. The grey bars represent the number of foci that would be expected to hit the particular sub-cluster if all foci with the respective label were randomly distributed.
Figure 5
Figure 5
(A) Testing the hypothesis derived from the behavioural domain analysis that the anterior cluster should be more involved in working memory, the posterior in action. The top left panel shows the differential co-activation map of the anterior (red) and posterior (green) cluster. The lower left panel shows the results of the fMRI analysis for “working memory > finger tapping” (red) and “finger tapping > working memory” (green) and illustrates the close correspondence with the hypothesis from the MACM analysis. The right panel shows the activation (contrast estimates and 95% confidence intervals) of the two medial premotor clusters by the two tasks and demonstrates the distinction in functional activation between them as hypothesised. (B) Testing the hypotheses on functional connectivity derived from the differential MACM analysis. The upper panel shows the location of the 39 peaks from the difference analysis between the co-activation maps for which a differential (resting state) functional connectivity was hypothesised. Low frequency resting state correlations between the two medial premotor clusters and these 39 locations were calculated, transformed into Fisher’s z-scores and compared for higher connectivity with either cluster. The lower panel summarises the results of this analysis (cf. details in supplementary figures 6–9). This bar diagram provides the mean and standard error of the Fisher z-transformed correlation coefficients with the two clusters. Coloured bars indicate a significantly (p < 0.05, Bonferroni-corrected for multiple comparisons) higher correlation with the anterior (red) or posterior (green) cluster, grey bars non-significant differences. All regions which showed significantly higher co-activation likelihoods with the anterior cluster also showed significantly higher resting-state connectivity with it. For the posterior cluster this was true for all but four regions, again confirming the hypotheses derived from the MACM analysis.

References

    1. Amunts K, Schleicher A, Zilles K. Cytoarchitecture of the cerebral cortex--more than localization. Neuroimage. 2007;37:1061–1065. - PubMed
    1. Anwander A, Tittgemeyer M, von Cramon DY, Friederici AD, Knosche TR. Connectivity-Based Parcellation of Broca’s Area. Cerebral Cortex. 2007;17:816–825. - PubMed
    1. Behrens TE, Woolrich MW, Jenkinson M, Johansen-Berg H, Nunes RG, Clare S, Matthews PM, Brady JM, Smith SM. Characterization and propagation of uncertainty in diffusion-weighted MR imaging. Magn Reson Med. 2003;50:1077–1088. - PubMed
    1. Biswal B, Yetkin FZ, Haughton VM, Hyde JS. Functional connectivity in the motor cortex of resting human brain using echo-planar MRI. Magn Reson Med. 1995;34:537–541. - PubMed
    1. Bremmer F, Schlack A, Shah NJ, Zafiris O, Kubischik M, Hoffmann K, Zilles K, Fink GR. Polymodal motion processing in posterior parietal and premotor cortex: a human fMRI study strongly implies equivalencies between humans and monkeys. Neuron. 2001;29:287–296. - PubMed

Publication types

LinkOut - more resources