. 2011 Sep 1;39(16):6879-85.
doi: 10.1093/nar/gkr390. Epub 2011 May 23.

Direct and indirect effects in the regulation of overlapping promoters

Affiliations

Direct and indirect effects in the regulation of overlapping promoters

Kristian Moss Bendtsen et al. Nucleic Acids Res. .

Abstract

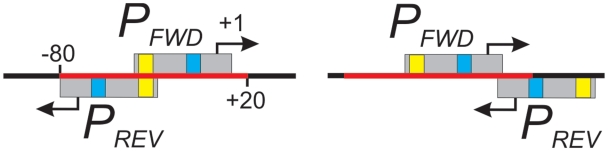
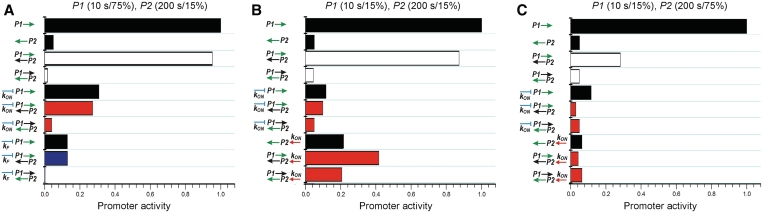
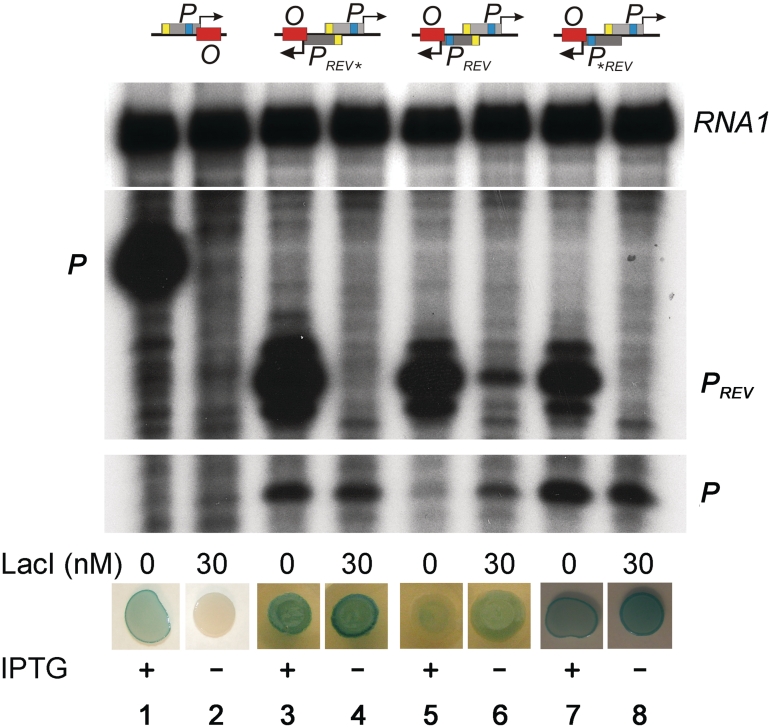
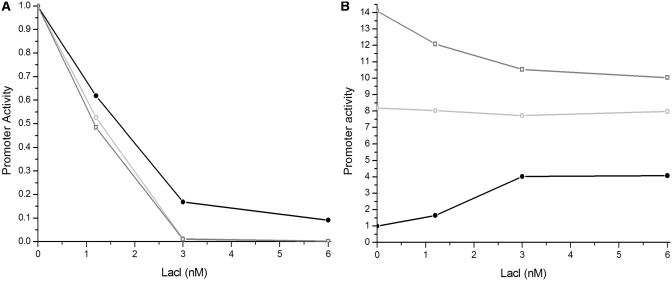
Optimal response to environmental stimuli often requires activation of certain genes and repression of others. Dual function regulatory proteins play a key role in the differential regulation of gene expression. While repression can be achieved by any DNA binding protein through steric occlusion of RNA polymerase in the promoter region, activation often requires a surface on the regulatory protein to contact RNAP and thus facilitate transcription initiation. RNAP itself is also a DNA binding protein, therefore it can function as a transcriptional repressor. Searching the Escherichia coli promoter database we found that ∼14% of the identified 'forward' promoters overlap with a promoter oriented in the opposite direction. In this article we combine a mathematical model with experimental analysis of synthetic regulatory regions to investigate interference of overlapping promoters. We find that promoter interference depends on the characteristics of overlapping promoters. The model predicts that promoter strength and interference can be regulated separately, which provides unique opportunities for regulation. Our experimental data suggest that in principle any DNA binding protein can be used for both activation and repression of promoter transcription, depending on the context. These findings can be exploited in the construction of synthetic networks.


Figures

Figure 1.
Figure 1.
Arrangements of overlapping promoters. Promoters can be arranged head-to-head (right) or tail-to tail (left). Transcription start points (tsp) are indicated by arrows. The tsp of the forward promoter (PFWD) serves as +1 in the numbering system. Gray boxes show the DNA regions occupied by RNAP (from −40 to +10). The −10 (blue) and −35 (yellow) promoter elements are indicated. All the reverse promoters (PREV) with a tsp falling into the red region (from −80 to +20) are considered to be overlapping promoters with PFWD.
Figure 2.
Figure 2.
Computed prediction of interference of overlapping promoters. Activity of a promoter (P1) in terms of its own and the opposing promoter's (P2) aspect ratios (α1 and α2) (left panel). Activity of promoter P1 in terms of its own and the opposing promoter's basal occupancies (θ10 and θ20) (right panel). Activities are measured in fraction of the intrinsic promoter activity of P1. Simulations were done with two promoters arranged tail-to-tail, with 1 bp overlap.
Figure 3.
Figure 3.
Examples of simulated responses of overlapping promoters to regulation of one of the promoters. Regulation of the promoters (arrows) is shown on the left. Bars show activities of promoters labeled with green arrows. Black bars show intrinsic promoter activities. Unregulated promoter strengths (firing frequencies in seconds) and aggressiveness of promoters (the fraction of time RNAP spends at the promoter, %) are shown on the top of each panel. White bars show promoter activities when the two promoters, P1 and P2 overlap. Red bars indicate differential effect of regulation while blue bars indicate that both promoter activities change in the same direction.
Figure 4.
Figure 4.
Synthetic regulatory region used in the in vitro and in vivo studies. Schematic drawings of regulatory regions are shown on the left. Gray boxes represent promoters, in which the −35 elements (yellow) and −10 elements (blue) are highlighted. Transcription start points are indicated by arrows. The red box represents a symmetric LacI operator site (O). The promoter elements are not shown when mutated in the reverse promoter PREV (typed boldface and underlined in the sequence).
Figure 5.
Figure 5.
Regulation of overlapping synthetic promoters in vitro and in vivo. Schematic drawings of regulatory regions are shown on top (see also Figure 4). Results of in vitro transcription from the promoter P and PREV in the presence and absence of LacI are shown below each drawing. The RNA1 transcript, which is not affected by LacI binding, was used as an internal control between lanes (see also Supplementary Figure S2). The regulatory regions were inserted into the E. coli chromosome in such orientation that the promoter P transcribes the uidA reporter gene, encoding β-glucuronidase. Expression of the reporter gene in the presence and absence of IPTG is indicated by the blue color of colonies, resulted from degradation of X-gluc by the β-glucuronidase enzyme.
Figure 6.
Figure 6.
The effect of LacI on promoter activities. In vitro transcription was performed at different LacI concentrations and the amount of P and PREV transcripts were quantified as described in the ‘Materials and Methods’ section. (A) PREV (black dots), PREV* (gray circles), P*REV (gray squares) activities as a function of LacI concentration. The background corrected and RNA1 normalized values were normalized for the corresponding promoter activities in the absence of LacI (=1). The relative activities of PREV, PREV* and P*REV in the absence of LacI are 1.00, 2.38 and 0.99, respectively. (B) P promoter activities as a function of LacI concentration when the P promoter is overlapped with PREV (black dots), PREV* (gray circles) and P*REV (gray squares). The background corrected and RNA1 normalized values were normalized for the promoter activity of the P promoter when overlapped with PREV, in the absence of LacI (=1). For comparison of activities in panels (A) and (B), PREV shows ∼80 times higher activity than P when LacI is absent.

Similar articles

Cited by

References

    1. Perez-Martin J, Rojo F, de Lorenzo V. Promoters responsive to DNA bending: a common theme in prokaryotic gene expression. Microbiol. Rev. 1994;58:268–290. - PMC - PubMed
    1. Ptashne M, Gann A. Genes and Signals. Cold Spring Harbor, NY: Cold Spring Harbor Laboratory Press; 2002.
    1. Hunziker A, Tuboly C, Horvath P, Krishna S, Semsey S. Genetic flexibility of regulatory networks. Proc. Natl Acad. Sci. USA. 2010;107:12998–13003. - PMC - PubMed
    1. Perez-Martin J, Espinosa M. Protein-induced bending as a transcriptional switch. Science. 1993;260:805–807. - PubMed
    1. Choy HE, Park SW, Aki T, Parrack P, Fujita N, Ishihama A, Adhya S. Repression and activation of transcription by Gal and Lac repressors: involvement of alpha subunit of RNA polymerase. EMBO J. 1995;14:4523–4529. - PMC - PubMed

Publication types

MeSH terms

Substances