

The distinctive roles of erythroid specific activator GATA-1 and NF-E2 in transcription of the human fetal γ-globin genes
- PMID: 21609963
- PMCID: PMC3167640
- DOI: 10.1093/nar/gkr253
The distinctive roles of erythroid specific activator GATA-1 and NF-E2 in transcription of the human fetal γ-globin genes
Abstract
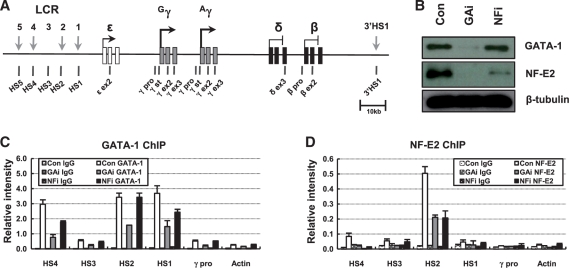
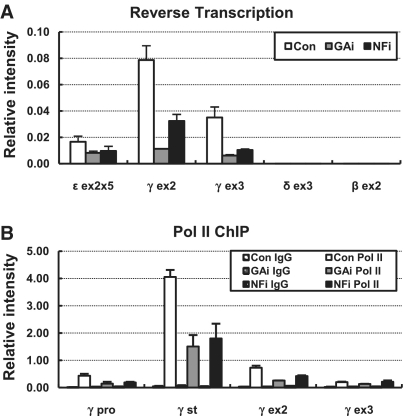
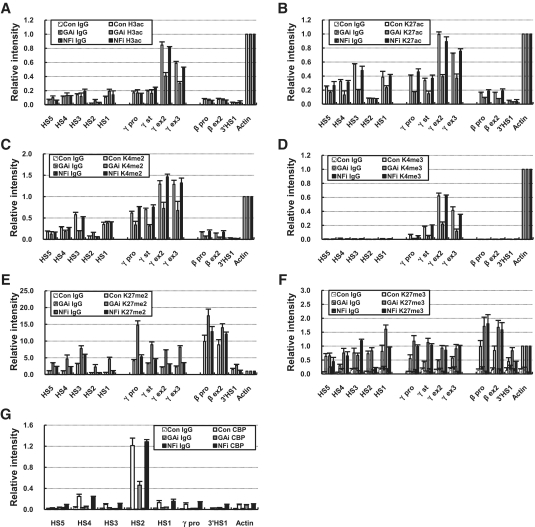
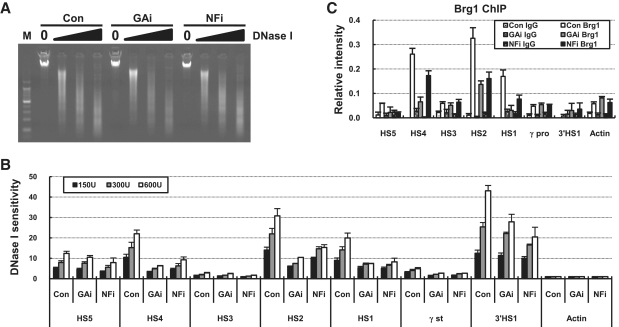
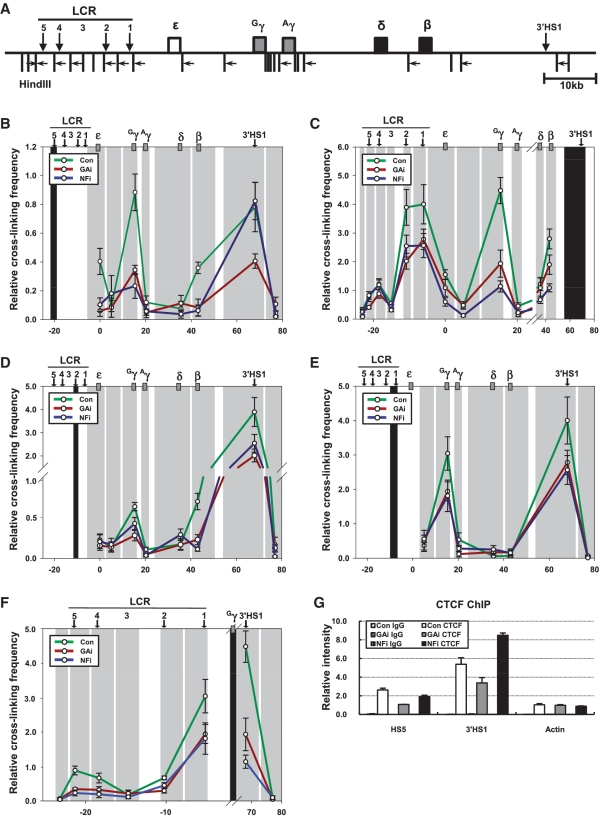
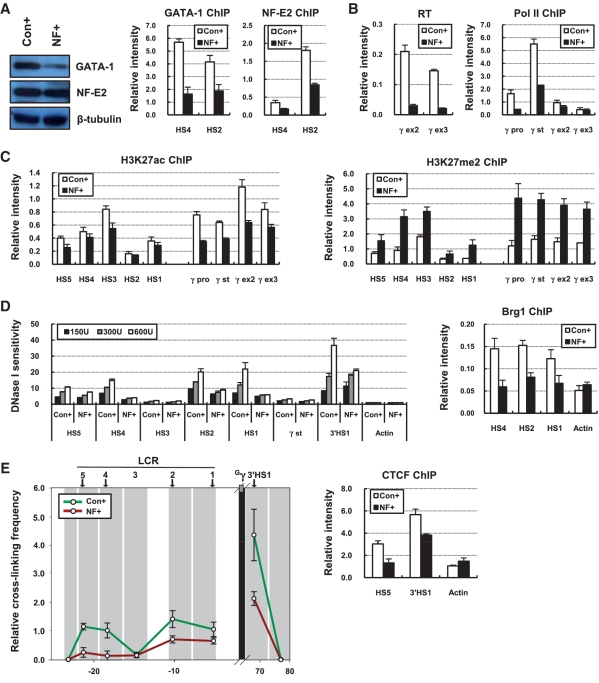
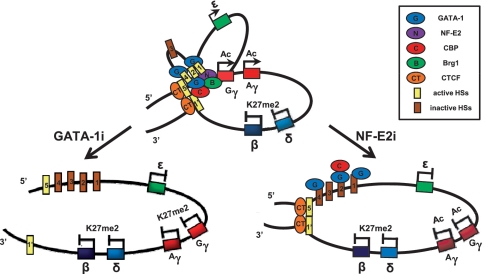
GATA-1 and NF-E2 are erythroid specific activators that bind to the β-globin locus. To explore the roles of these activators in transcription of the human fetal stage specific γ-globin genes, we reduced GATA-1 and p45/NF-E2 using shRNA in erythroid K562 cells. GATA-1 or p45/NF-E2 knockdown inhibited the transcription of the γ-globin genes, hypersensitive site (HS) formation in the LCR and chromatin loop formation of the β-globin locus, but histone acetylation across the locus was decreased only in the case of GATA-1 knockdown. In p45/NF-E2 knockdown cells, GATA-1 binding was maintained at the LCR HSs and γ-globin promoter, but NF-E2 binding at the LCR HSs was reduced by GATA-1 knockdown regardless of the amount of p45/NF-E2 in K562 cells. These results indicate that histone acetylation is dependent on GATA-1 binding, but the binding of GATA-1 is not sufficient for the γ-globin transcription, HS formation and chromatin loop formation and NF-E2 is required. This idea is supported by the distinctive binding pattern of CBP and Brg1 in the β-globin locus. Furthermore GATA-1-dependent loop formation between HS5 and 3'HS1 suggests correlation between histone modifications and chromatin looping.
Figures
Similar articles
-
The hematopoietic regulator TAL1 is required for chromatin looping between the β-globin LCR and human γ-globin genes to activate transcription.Nucleic Acids Res. 2014 Apr;42(7):4283-93. doi: 10.1093/nar/gku072. Epub 2014 Jan 26. Nucleic Acids Res. 2014. PMID: 24470145 Free PMC article.
-
Expression of GATA-1 in a non-hematopoietic cell line induces beta-globin locus control region chromatin structure remodeling and an erythroid pattern of gene expression.J Mol Biol. 2007 Feb 23;366(3):737-44. doi: 10.1016/j.jmb.2006.11.094. Epub 2006 Dec 6. J Mol Biol. 2007. PMID: 17196618 Free PMC article.
-
Histone acetylation contributes to chromatin looping between the locus control region and globin gene by influencing hypersensitive site formation.Biochim Biophys Acta. 2013 Sep;1829(9):963-9. doi: 10.1016/j.bbagrm.2013.04.006. Epub 2013 Apr 20. Biochim Biophys Acta. 2013. PMID: 23607989
-
ChIPs of the beta-globin locus: unraveling gene regulation within an active domain.Curr Opin Genet Dev. 2002 Apr;12(2):170-7. doi: 10.1016/s0959-437x(02)00283-6. Curr Opin Genet Dev. 2002. PMID: 11893490 Review.
-
Erythroid regulatory elements.Stem Cells. 1993 Mar;11(2):95-104. doi: 10.1002/stem.5530110204. Stem Cells. 1993. PMID: 8096156 Review.
Cited by
-
The hematopoietic regulator TAL1 is required for chromatin looping between the β-globin LCR and human γ-globin genes to activate transcription.Nucleic Acids Res. 2014 Apr;42(7):4283-93. doi: 10.1093/nar/gku072. Epub 2014 Jan 26. Nucleic Acids Res. 2014. PMID: 24470145 Free PMC article.
-
A tissue-specific chromatin loop activates the erythroid ankyrin-1 promoter.Blood. 2012 Oct 25;120(17):3586-93. doi: 10.1182/blood-2012-08-450262. Epub 2012 Sep 11. Blood. 2012. PMID: 22968456 Free PMC article.
-
Shift in GATA3 functions, and GATA3 mutations, control progression and clinical presentation in breast cancer.Breast Cancer Res. 2014 Nov 20;16(6):464. doi: 10.1186/s13058-014-0464-0. Breast Cancer Res. 2014. PMID: 25410484 Free PMC article.
-
Ldb1 regulates carbonic anhydrase 1 during erythroid differentiation.Biochim Biophys Acta. 2012 Aug;1819(8):885-91. doi: 10.1016/j.bbagrm.2012.05.001. Epub 2012 May 18. Biochim Biophys Acta. 2012. PMID: 22609543 Free PMC article.
-
[Influence of HIF- 2α on the expression of GATA- 1 in bone marrow CD71(+) cell of high altitude polycythemia rat model].Zhonghua Xue Ye Xue Za Zhi. 2016 Aug 14;37(8):696-701. doi: 10.3760/cma.j.issn.0253-2727.2016.08.013. Zhonghua Xue Ye Xue Za Zhi. 2016. PMID: 27587253 Free PMC article. Chinese.
References
Publication types
MeSH terms
Substances
LinkOut - more resources
Full Text Sources
Research Materials
Miscellaneous
