. 2011 Jul 15;286(28):24819-27.
doi: 10.1074/jbc.M111.247536. Epub 2011 May 24.

Transcription factors KLF1 and KLF2 positively regulate embryonic and fetal beta-globin genes through direct promoter binding

Affiliations

Transcription factors KLF1 and KLF2 positively regulate embryonic and fetal beta-globin genes through direct promoter binding

Yousef N Alhashem et al. J Biol Chem. .

Abstract

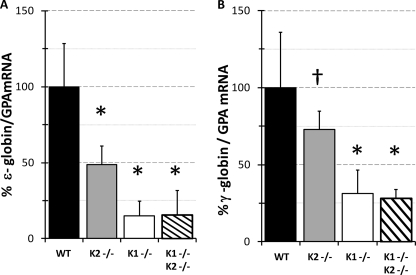
Krüppel-like factors (KLFs) control cell differentiation and embryonic development. KLF1 (erythroid Krüppel-like factor) plays essential roles in embryonic and adult erythropoiesis. KLF2 is a positive regulator of the mouse and human embryonic β-globin genes. KLF1 and KLF2 have highly homologous zinc finger DNA-binding domains. They have overlapping roles in embryonic erythropoiesis, as demonstrated using single and double KO mouse models. Ablation of the KLF1 or KLF2 gene causes embryonic lethality, but double KO embryos are more anemic and die sooner than either single KO. In this work, a dual human β-globin locus transgenic and KLF knockout mouse model was used. The results demonstrate that the human ε- (embryonic) and γ-globin (fetal) genes are positively regulated by KLF1 and KLF2 in embryos. Conditional KO mouse experiments indicate that the effect of KLF2 on embryonic globin gene regulation is at least partly erythroid cell-autonomous. KLF1 and KLF2 bind directly to the promoters of the human ε- and γ-globin genes, the mouse embryonic Ey- and βh1-globin genes, and also to the β-globin locus control region, as demonstrated by ChIP assays with mouse embryonic blood cells. H3K9Ac and H3K4me3 marks indicate open chromatin and active transcription, respectively. These marks are diminished at the Ey-, βh1-, ε- and γ-globin genes and locus control region in KLF1(-/-) embryos, correlating with reduced gene expression. Therefore, KLF1 and KLF2 positively regulate the embryonic and fetal β-globin genes through direct promoter binding. KLF1 is required for normal histone modifications in the β-globin locus in mouse embryos.


Figures

FIGURE 1.
FIGURE 1.
Developmental expression patterns of KLF1 and KLF2 mRNA. Expression of KLF1 and KLF2 mRNA during primitive (E9.5 blood) and definitive (E12.5 fetal liver) erythropoiesis. Erythroid cells from E9.5 circulating blood and E12.5 fetal liver are in similar stages of differentiation. The amounts of mouse KLF1 and KLF2 mRNA were measured using qRT-PCR and normalized to cyclophilin A. Fold change was calculated using the 2ΔCT method after correcting for different primer efficiency. At least four biological replicates were tested at each time point. *, p <0.05). Error bars, S.D.
FIGURE 2.
FIGURE 2.
KLF1 and KLF2 positively regulate human embryonic and fetal β-globin gene expression. Human embryonic and fetal β-globin gene expression in yolk sacs from KLF1−/−KLF2−/− at E10.5 compared with wild-type and single knockouts. A, ϵ-globin mRNA. B, γ-globin mRNA. GPA mRNA was used as an internal standard for quantitative RT-PCR. The globin-to-GPA mRNA ratio for WT was taken as 100% and for the other genotypes is expressed compared with WT. The KLF2−/− data comes from a previous study (17). †, p < 0.05; *, p < 0.025 compared with WT. Between four and six biological replicates were used. Error bars, S.D. K1−/−, KLF1−/−; K2−/−, KLF2−/−.
FIGURE 3.
FIGURE 3.
Erythroid cell-autonomous regulation of mouse βh1- and Ey-globin expression by KLF2. Mouse embryonic globin mRNA was quantified in KLF2F/F, ErGFP-Cre (erythroid conditional knockout), and KLF2F/F (wild-type) mouse E10.5 erythroid cells. Cyclophilin A mRNA was used as an internal standard for qRT-PCR. The globin-to-cyclophilin mRNA ratio for KLF2F/F was taken as 100%. Shown are mouse embryonic βh1-globin (A), Ey-globin (B), and KLF2 mRNA (C). *, p < 0.05. For KLF2F/F, n = 5 or 6 and for KLF2F/F,ErGFP-Cre, n = 8. Error bars, S.D.
FIGURE 4.
FIGURE 4.
KLF1 and KLF2 bind the mouse and human β-globin loci in primitive erythroid cells. ChIP assays were performed on E10.5 (A) or E11.5 (B and C) primitive erythroid cells of normal mice or transgenic mice that carry the entire human β-globin locus. Polyclonal antibodies specific for KLF1 (A and B) or KLF2 (C) and nonspecific IgG control antibody were used. The y axis represents the relative fold enrichment. The mean IgG enrichment was set as 1.0, and the enrichment of KLF1 was scaled appropriately. The x axis shows the location of the primers used for qPCR. Pr, promoter. The primers were specific to the DNase I hypersensitive sites 5′HS2 and 5′HS3, the promoters of the mouse (Ey-, βh1-, βmaj-) and the human β-globin genes (ϵ, γ, and β). Primers specific to β-actin were used as negative controls. *, significant enrichment compared with IgG (p <0.05). A, KLF1 ChIP on E10.5 erythroid cells, n = 3. B, KLF1 ChIP on E11.5 erythroid cells, n = 3. C, KLF2 ChIP on E11.5 erythroid cells. Two KLF2 antibodies were used on the mouse β-globin locus (one was from Santa Cruz, and the other was a gift from Dr. Ng). Mouse locus and β-actin, n = 4 for IgG and KLF2_Ng; n = 2 for KLF2_SC; human locus, n = 2. Error bars, S.E.
FIGURE 5.
FIGURE 5.
Differential enrichment of H3K9Ac and H3K4me3 at the mouse and human β-globin loci in WT, KLF1−/− and KLF2−/− primitive erythroid cells. ChIP assays using anti-H3K9Ac (A and C) or anti-H3K4me3 (B and D) were performed on E10.5 erythroid cells from WT, KLF1−/− (A and B), or KLF2−/− (C and D) embryos with the human β-globin locus. H3K9Ac generally indicates open chromatin conformation, whereas H3K4me3 indicates active transcription. The mean IgG enrichment was set as 1.0, and the enrichment of H3K9Ac or H3K4me3 were scaled appropriately. Necdin was used as a negative control. Ex, exonic region. n = 3. Error bars, S.E.; *, significant enrichment compared with IgG (p <0.05).

References

    1. Baron M. H., Fraser S. T. (2005) Curr. Opin. Hematol. 12, 217–221 - PubMed
    1. Qiu C., Olivier E. N., Velho M., Bouhassira E. E. (2008) Blood 111, 2400–2408 - PMC - PubMed
    1. McGrath K. E., Palis J. (2005) Exp. Hematol. 33, 1021–1028 - PubMed
    1. Brotherton T. W., Chui D. H., Gauldie J., Patterson M. (1979) Proc. Natl. Acad. Sci. U.S.A. 76, 2853–2857 - PMC - PubMed
    1. Grosveld F., van Assendelft G. B., Greaves D. R., Kollias G. (1987) Cell 51, 975–985 - PubMed

Publication types

MeSH terms