Review
. 2011 Sep 1;3(9):a004614.
doi: 10.1101/cshperspect.a004614.

Shotgun lipidomics on high resolution mass spectrometers

Affiliations
Review

Shotgun lipidomics on high resolution mass spectrometers

Dominik Schwudke et al. Cold Spring Harb Perspect Biol. .

Abstract

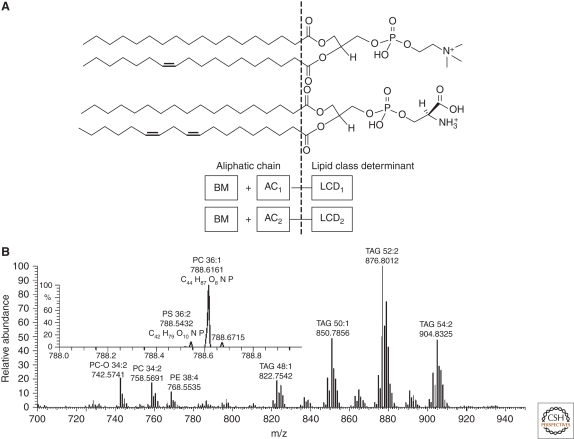
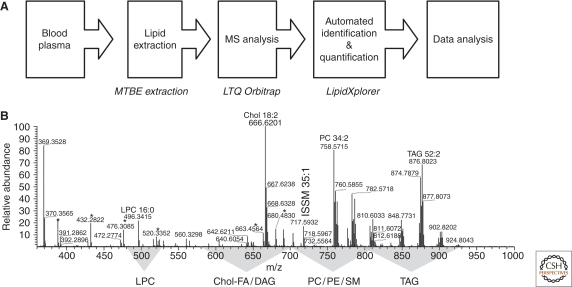
Despite their compositional complexity, lipidomes comprise a large number of isobaric species that cannot be distinguished by conventional low resolution mass spectrometry and therefore in-depth MS/MS analysis was required for their accurate quantification. Here we argue that the progress in high resolution mass spectrometry is changing the concept of lipidome characterization. Because exact masses of isobaric species belonging to different lipid classes are not necessarily identical, they can now be distinguished and directly quantified in total lipid extracts. By streamlining and simplifying the molecular characterization of lipidomes, high resolution mass spectrometry has developed into a generic tool for cell biology and molecular medicine.


Figures

Figure 1.
Figure 1.
Molecular ions of isobaric species could be distinguished in high resolution mass spectra. (A) Chemical structures of molecular cations of isobaric PC 36:1 and PS 36:2. In general, masses of isobaric species should meet the following requirements: (LCD1+AC1)(LCD2+AC2+BM)0;BM=x1(14.0153)d1(2.0153)or(LCD1+AC1BM)(LCD2+AC2)0;BM=x2(14.0153)+d2(2.0153) Here LCD stands for the mass of lipid class determinant; AC, mass of the aliphatic complement of the first and second lipid species; BM, balance mass required to form a pair of isobaric lipid species; x1, x2, number of methylene groups; and d1, d2, the number of double bonds. (B) LTQ Orbitrap MS spectrum of a total lipid extract of bovine heart acquired at the resolution of 100,000. Monoisotopic peaks of isobaric PS 36:2 and PC 36:1 are shown in the inset.
Figure 2.
Figure 2.
Top-down lipidomics screen of human blood plasma extracts. (A) A workflow of a top-down lipidomics screen encompassing blood plasma samples collected from 70 patients. In total, 151 high-resolution spectra were acquired. (B) Representative MS spectrum of a total blood plasma extract acquired at the LTQ Orbitrap XL mass spectrometer. Here only the most abundant species are annotated; m/z ranges in which peaks of the species of major lipid class were located, are highlighted. Most abundant peaks of chemical noise are designated with asterisks. IS, internal standard spiked into samples prior to lipid extraction.
Figure 3.
Figure 3.
FT MS/MS spectrum of PS 18:0/22:6 acquired in negative mode with the target mass resolution of 30,000 acquired on a LTQ Orbitrap XL instrument. Peaks of the acyl anion of FA 18:0 and the product of CO2 loss from the acyl anion of FA 22:6 were fully resolved.
Figure 4.
Figure 4.
FT MS/MS spectrum of a low abundant precursor ion with m/z 1066.7490 (0.8 ppm) detected by shotgun analysis of a total lipid extract of rat retina in negative ion mode. Spectrum interpretation revealed that this precursor ion represents two very long chain polyunsaturated species of PC 32:4/22:6 and PC 34:6/20:4 ([M + HCOO]). As judged from the relative intensity of acyl anion fragments, FA 32:4 and 34:6 are at the sn − 1 position, whereas FA 22:6 and FA 20:4 are at the sn − 2 position of the glycerol backbone of the corresponding PC species. Masses of fragment ions were determined with the low ppm accuracy: [M-15]- fragment at m/z 1006.7218 (−5.2 ppm), acyl anion of FA 34:6 at m/z 495.4202 (−1.1 ppm), acyl anion of FA 32:4 at m/z 471.4206 (−0.3 ppm), acyl anion of FA 22:6 at m/z 327.2327 (−0.8 ppm), acyl anion of FA 20:4 at m/z 303.2328 (−0.5 ppm), and the product of neutral loss of CO2 from the acyl anion of FA 22:6 at m/z 283.2431 (−0.1 ppm).
Figure 5.
Figure 5.
Part of the FT MS spectrum of a total extract of human adipose tissue acquired in positive ion mode at a LTQ Orbitrap XL mass spectrometer. TAG peaks were detected as ammonium adducts [M + NH4]+ and are annotated by m/z and total number of carbon atoms and double bonds. Following MS/MS fragmentation, TAG precursors underwent neutral losses of fatty acid moieties and ammonium. Inset shows a part of FT MS/MS spectrum acquired from precursor(s) having m/z 860.7703. Peaks of neutral loss fragments are designated with their m/z, the acronym NL XX:Y stands for the product of neutral loss of the acid moiety having XX carbon atoms and Y double bonds. Target mass resolution defined at m/z 400 was 100,000 and 30,000 in MS and MS/MS modes, respectively.

References

    1. Bartz R, Li WH, Venables B, Zehmer JK, Roth MR, Welti R, Anderson RG, Liu P, Chapman KD 2007. Lipidomics reveals that adiposomes store ether lipids and mediate phospholipid traffic. J Lipid Res 48: 837–847 - PubMed
    1. Blanksby SJ, Mitchell TW 2010. Advances in mass spectrometry for lipidomics. Annu Rev Anal Chem (Palo Alto Calif) 3: 433–465 - PubMed
    1. Bligh EG, Dyer WJ 1959. A rapid method of total lipid extraction and purification. Can J Biochem Physiol 37: 911–917 - PubMed
    1. Brenton AG, Godfrey AR 2010. Accurate mass measurement: Terminology and treatment of data. J Am Soc Mass Spectrom 21: 1821–1835 - PubMed
    1. Dennis EA 2009. Lipidomics joins the omics evolution. Proc Natl Acad Sci 106: 2089–2090 - PMC - PubMed

Publication types

LinkOut - more resources