. 2011 Oct;19(10):1059-65.
doi: 10.1038/ejhg.2011.89. Epub 2011 May 25.

Treatment of spinal muscular atrophy cells with drugs that upregulate SMN expression reveals inter- and intra-patient variability

Affiliations

Treatment of spinal muscular atrophy cells with drugs that upregulate SMN expression reveals inter- and intra-patient variability

Eva Also-Rallo et al. Eur J Hum Genet. 2011 Oct.

Abstract

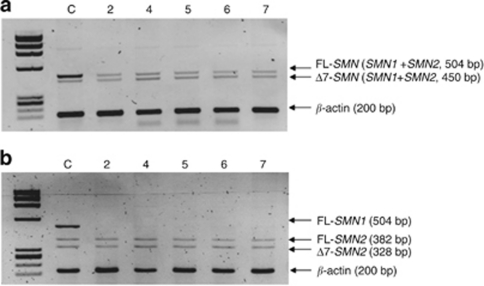
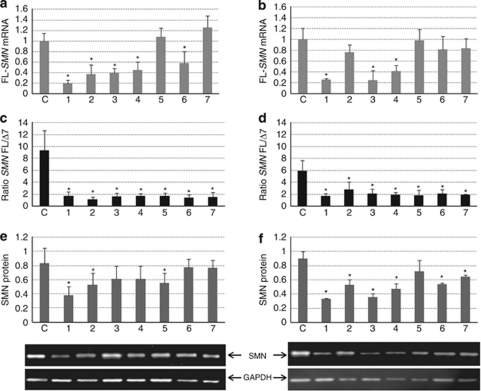
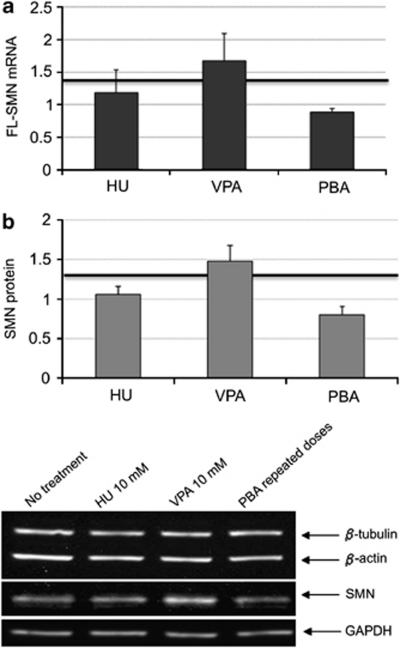
Spinal muscular atrophy (SMA) is a genetic neuromuscular disorder caused by mutations in the SMN1 gene. The homologous copy (SMN2) is always present in SMA patients. SMN1 gene transcripts are usually full-length (FL), but exon 7 is spliced out in a high proportion of SMN2 transcripts (delta7) (Δ7). Advances in drug therapy for SMA have shown that an increase in SMN mRNA and protein levels can be achieved in vitro. We performed a systematic analysis of SMN expression in primary fibroblasts and EBV-transformed lymphoblasts from seven SMA patients with varying clinical severity and different SMN1 genotypes to determine expression differences in two accessible tissues (skin and blood). The basal expression of SMN mRNA FL and Δ7 in fibroblasts and lymphoblasts was analyzed by quantitative real-time PCR. The FL-SMN and FL/Δ7 SMN ratios were higher in control cells than in patients. Furthermore, we investigated the response of these cell lines to hydroxyurea, valproate and phenylbutyrate, drugs previously reported to upregulate SMN2. The response to treatments with these compounds was heterogeneous. We found both intra-patient and inter-patient variability even within haploidentical siblings, suggesting that tissue and individual factors may affect the response to these compounds. To optimize the stratification of patients in clinical trials, in vitro studies should be performed before enrolment so as to define each patient as a responder or non-responder to the compound under investigation.


Figures

Figure 1
Figure 1
Origin of the FL-SMN transcripts in patients with the c.399_402del AGAG mutation. (a) RT-PCR analysis of total RNA extracted from fibroblasts. The 504-bp fragment includes exons 6–8 of the SMN gene. The 450-bp fragment includes exons 6–8 lacking exon 7 and the 200-bp fragment corresponds to the β-actin fragment. (b) DdeI digestion of the SMN RT-PCR amplified fragment to determine the origin of the various transcripts. Note that no SMN transcripts originate from the SMN1 gene in these patients. All patients are identified using the same numbers as in Table 1.
Figure 2
Figure 2
Baseline levels of SMN mRNA and protein. (a) Histogram showing the FL-SMN mRNA in fibroblasts and (b) lymphoblasts relative to control levels determined by the ΔΔCt method. (c) Histogram of FL/Δ7 mRNA ratio in fibroblasts and (d) lymphoblasts. (e) Histogram of SMN protein levels in fibroblasts and (f) in lymphoblasts relative to GAPDH as depicted by the respective immunoblots (results with β-actin and β-tubulin were similar, data not shown). C=mean of C1, C2 and C3; 1–7=SMA patients. All patients are identified using the same numbers as in Table 1.
Figure 3
Figure 3
Histograms showing the effect of treatment of seven SMA cells with hydroxyurea (HU), valproic acid (VPA) and phenylbutyrate (PBA). (a) Levels of FL-SMN transcript in fibroblasts and (b) lymphoblasts determined by the ΔΔCt method. We observed variations in GAPDH Ct values (≤0.5) after different biological replicates, resulting in up to 1.4-fold differences. Thus, an increase of mRNA FL-SMN was considered positive when the value obtained was more than 1.4-fold its baseline level. (c) Histogram showing the effect of the same compounds on levels of SMN protein detected by immunoblot in fibroblasts and (d) lymphoblasts. Levels of mRNA and protein are depicted according to the maximum increase observed and are expressed as n-fold their baseline set to 1 (continuous line). The highest values of protein were reached at 24 h, with the exception of patient 2, whose peak values for HU and VPA treatment were reached at 48 h, and patient 1, whose peak values for PBA were reached at 8 h. Owing to the standard deviation observed in basal protein levels (≤30%) (Figures 2e and f), values higher than 1.3-fold were considered positive. The thick line represents the threshold for positive response. All patients are identified using the same numbers as in Table 1.
Figure 4
Figure 4
Histograms showing the effect of the increase in dose (10 m) of HU and VPA and the repetitive administration of PBA (2 m) every 4 h in fibroblasts of the non-responder patient 3. (a) FL-SMN transcripts expressed as n-fold their baseline (set to 1). (b) Protein levels relative to β-actin and β-tubulin and GAPDH. Note that the increase of SMN expression was achieved only with VPA. The thick line represents the threshold for positive response.
Figure 5
Figure 5
Impact of the different compounds on cell viability determined by XTT assay. (a) Fibroblasts and (b) lymphoblasts treated with HU (1 m) VPA (1 m) and PBA (2 m); A decrease of around 20–30% in cell metabolism was observed in both cell lines (lymphoblasts tended to be more sensitive than fibroblasts); (c) fibroblasts and (d) lymphoblasts treated with a dose increase of one order of magnitude. The decrease was around 20–50% in fibroblasts and 40–80% in lymphoblasts. Each value is given as mean of four cell lines in three experiments ±SEM.

References

    1. Alias L, Bernal S, Fuentes-Prior P, et al. Mutation update of spinal muscular atrophy in Spain: molecular characterization of 745 unrelated patients and identification of four novel mutations in the SMN1 gene. Hum Genet. 2009;125:29–39. - PubMed
    1. Lefebvre S, Burglen L, Reboullet S, et al. Identification and characterization of a spinal muscular atrophy-determining gene. Cell. 1995;80:155–165. - PubMed
    1. Bussaglia E, Clermont O, Tizzano E, et al. A frame-shift deletion in the survival motor neuron gene in Spanish spinal muscular atrophy patients. Nat Genet. 1995;11:335–337. - PubMed
    1. Cusco I, Lopez E, Soler-Botija C, Jesus Barcelo M, Baiget M, Tizzano EF. A genetic and phenotypic analysis in Spanish spinal muscular atrophy patients with c.399_402del AGAG, the most frequently found subtle mutation in the SMN1 gene. Hum Mutat. 2003;22:136–143. - PubMed
    1. Martin Y, Valero A, del Castillo E, Pascual SI, Hernandez-Chico C. Genetic study of SMA patients without homozygous SMN1 deletions: identification of compound heterozygotes and characterisation of novel intragenic SMN1 mutations. Hum Genet. 2002;110:257–263. - PubMed

Publication types

MeSH terms