

Estimates of outcomes up to ten years after stroke: analysis from the prospective South London Stroke Register
- PMID: 21610863
- PMCID: PMC3096613
- DOI: 10.1371/journal.pmed.1001033
Estimates of outcomes up to ten years after stroke: analysis from the prospective South London Stroke Register
Abstract
Background: Although stroke is acknowledged as a long-term condition, population estimates of outcomes longer term are lacking. Such estimates would be useful for planning health services and developing research that might ultimately improve outcomes. This burden of disease study provides population-based estimates of outcomes with a focus on disability, cognition, and psychological outcomes up to 10 y after initial stroke event in a multi-ethnic European population.
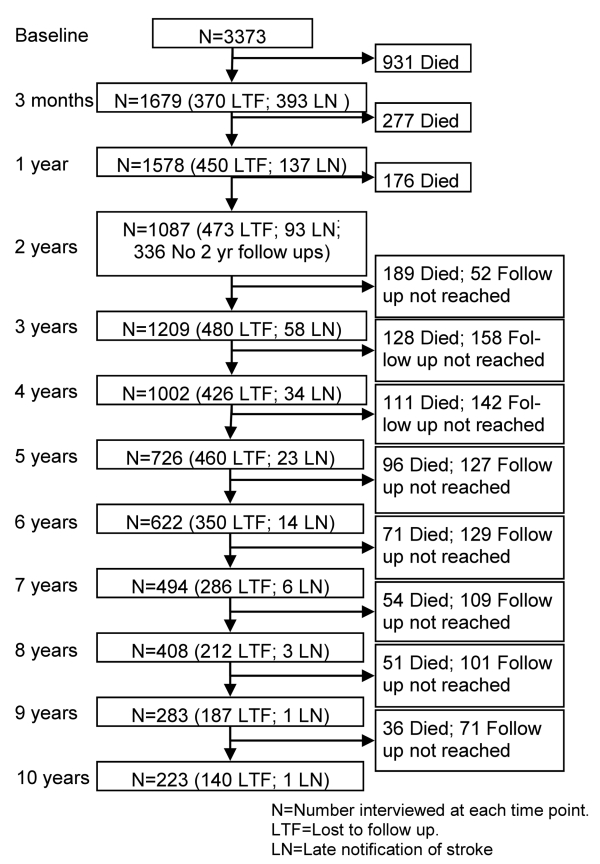
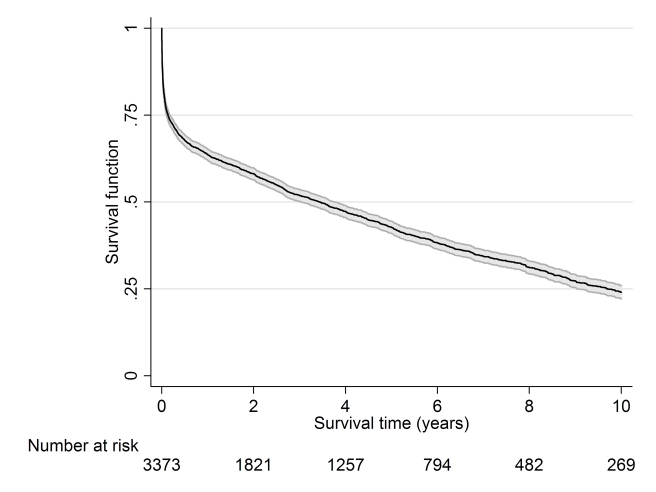
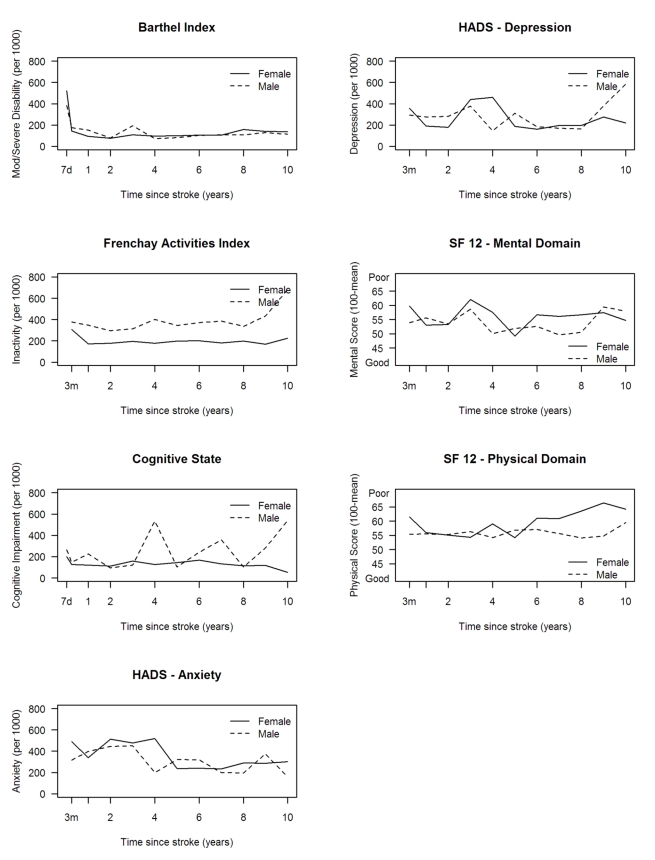
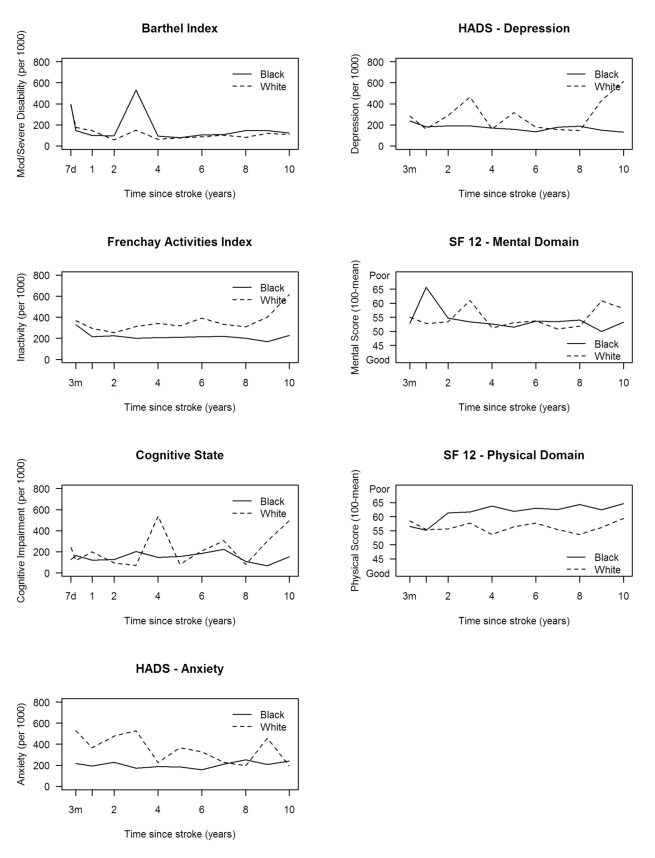
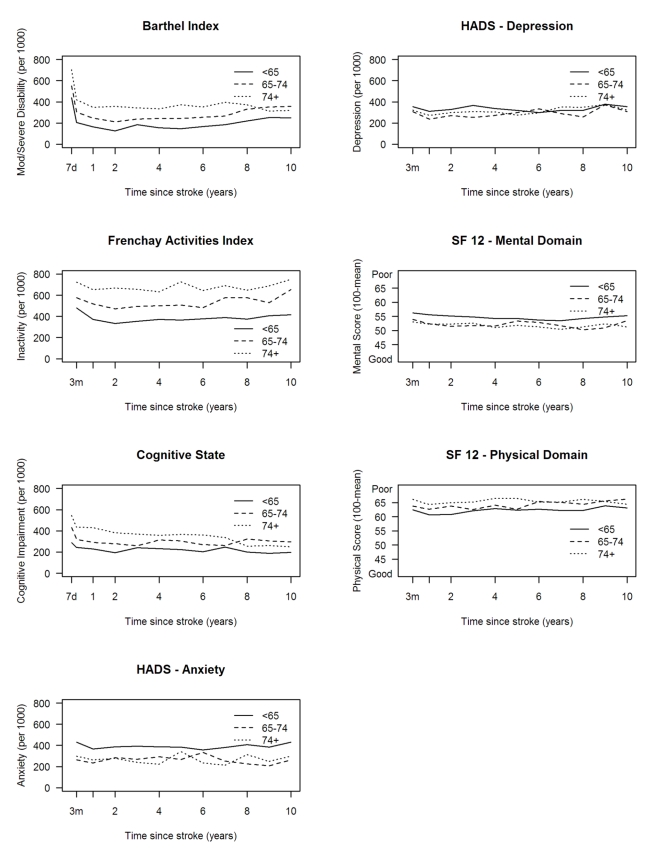
Methods and findings: Data were collected from the population-based South London Stroke Register, a prospective population-based register documenting all first in a lifetime strokes since 1 January 1995 in a multi-ethnic inner city population. The outcomes assessed are reported as estimates of need and included disability (Barthel Index <15), inactivity (Frenchay Activities Index <15), cognitive impairment (Abbreviated Mental Test < 8 or Mini-Mental State Exam <24), anxiety and depression (Hospital Anxiety and Depression Scale >10), and mental and physical domain scores of the Medical Outcomes Study 12-item short form (SF-12) health survey. Estimates were stratified by age, gender, and ethnicity, and age-adjusted using the standard European population. Plots of outcome estimates over time were constructed to examine temporal trends and sociodemographic differences. Between 1995 and 2006, 3,373 first-ever strokes were registered: 20%-30% of survivors had a poor outcome over 10 y of follow-up. The highest rate of disability was observed 7 d after stroke and remained at around 110 per 1,000 stroke survivors from 3 mo to 10 y. Rates of inactivity and cognitive impairment both declined up to 1 y (280/1,000 and 180/1,000 survivors, respectively); thereafter rates of inactivity remained stable till year eight, then increased, whereas rates of cognitive impairment fluctuated till year eight, then increased. Anxiety and depression showed some fluctuation over time, with a rate of 350 and 310 per 1,000 stroke survivors, respectively. SF-12 scores showed little variation from 3 mo to 10 y after stroke. Inactivity was higher in males at all time points, and in white compared to black stroke survivors, although black survivors reported better outcomes in the SF-12 physical domain. No other major differences were observed by gender or ethnicity. Increased age was associated with higher rates of disability, inactivity, and cognitive impairment.
Conclusions: Between 20% and 30% of stroke survivors have a poor range of outcomes up to 10 y after stroke. Such epidemiological data demonstrate the sociodemographic groups that are most affected longer term and should be used to develop longer term management strategies that reduce the significant poor outcomes of this group, for whom effective interventions are currently elusive. Please see later in the article for the Editors' Summary.
Conflict of interest statement
APG has consultancy agreements with Pfizer Global R&D, Takeda Global R&D (Europe), Cytel, Novartis, GSK, Viphor, Helsinn, and Eli Lilly. PUH has in the past 5 years had unrestricted research grants in the area of stroke from the German Ministry of Research and Education, the European Union, the Stanley Thomas Johnson Foundation, the University of Erlangen, and the German Stroke Foundation. AMT, named as a contributing author on this paper, died before the paper was formally accepted for publication. The other authors declare no competing interests.
Figures

References
-
- Lopez AD, Mathers CD, Ezzati M, Jamison DT, Murray CJL. Global and regional burden of disease and risk factors, 2001: systematic analysis of population health data. Lancet. 2006;367:1747–1757. - PubMed
-
- Department of Health. London: Her Majesty's Stationery Office; 2007. National stroke strategy. Available: http://www.dh.gov.uk/en/Publicationsandstatistics/Publications/Publicati.... Accessed 8 April 2011.
-
- Anderson CS, Carter KN, Brownlee WJ, Hackett ML, Broad JB, et al. Very long-term outcome after stroke in Auckland, New Zealand. Stroke. 2004;35:1920–1924. - PubMed
-
- Hackett ML, Duncan JR, Anderson CS, Broad JB, Bonita R. Health-related quality of life among long-term survivors of stroke: results from the Auckland Stroke Study, 1991-1992. Stroke. 2000;31:440–447. - PubMed
-
- Niemi ML, Laaksonen R, Kotila M, Waltimo O. Quality of life 4 years after stroke. Stroke. 1988;19:1101–1107. - PubMed
Publication types
MeSH terms
Grants and funding
LinkOut - more resources
Full Text Sources
Medical
