

The mechanics and energetics of human walking and running: a joint level perspective
- PMID: 21613286
- PMCID: PMC3223624
- DOI: 10.1098/rsif.2011.0182
The mechanics and energetics of human walking and running: a joint level perspective
Abstract
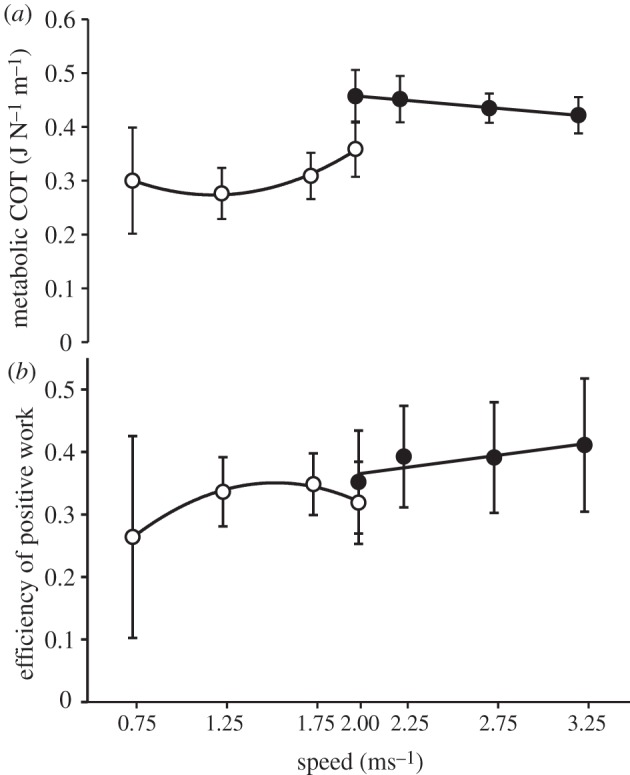
Humans walk and run at a range of speeds. While steady locomotion at a given speed requires no net mechanical work, moving faster does demand both more positive and negative mechanical work per stride. Is this increased demand met by increasing power output at all lower limb joints or just some of them? Does running rely on different joints for power output than walking? How does this contribute to the metabolic cost of locomotion? This study examined the effects of walking and running speed on lower limb joint mechanics and metabolic cost of transport in humans. Kinematic and kinetic data for 10 participants were collected for a range of walking (0.75, 1.25, 1.75, 2.0 m s(-1)) and running (2.0, 2.25, 2.75, 3.25 m s(-1)) speeds. Net metabolic power was measured by indirect calorimetry. Within each gait, there was no difference in the proportion of power contributed by each joint (hip, knee, ankle) to total power across speeds. Changing from walking to running resulted in a significant (p = 0.02) shift in power production from the hip to the ankle which may explain the higher efficiency of running at speeds above 2.0 m s(-1) and shed light on a potential mechanism behind the walk-run transition.
Figures
 and
and  or
or  and
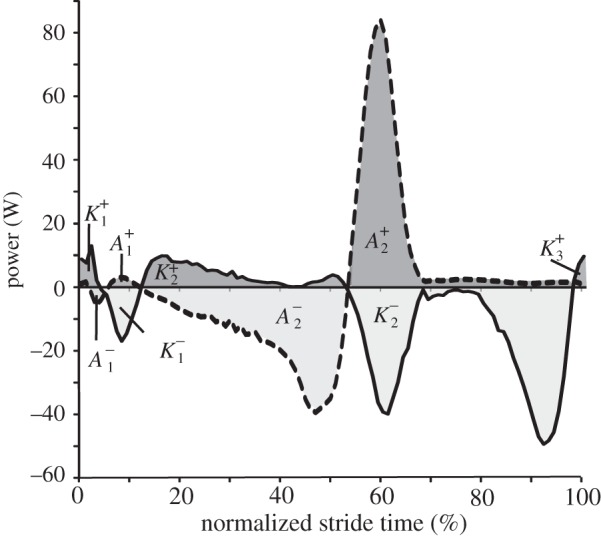
and  for the ankle and knee, respectively. Work done during each of these periods was calculated separately by integration using the trapezium rule. Positive and negative work done at each joint per stride was calculated as the sum of individual work values, e.g.
  .
.
References
-
- Heglund N. C., Fedak M. A., Taylor C. R., Cavagna G. A. 1982. Energetics and mechanics of terrestrial locomotion. IV. Total mechanical energy changes as a function of speed and body size in birds and mammals. J. Exp. Biol. 97, 57–66 - PubMed
-
- Kram R., Taylor C. R. 1990. Energetics of running: a new perspective. Nature 346, 265–267 10.1038/346265a0 (doi:10.1038/346265a0) - DOI - PubMed
-
- Ralston H. J. 1958. Energy expenditure of normal human subjects during walking. Federation Proc. 17, 127
-
- Fedak M. A., Heglund N. C., Taylor C. R. 1982. Energetics and mechanics of terrestrial locomotion. II. Kinetic-energy changes of the limbs and body as a function of speed and body size in birds and mammals. J. Exp. Biol. 97, 23–40 - PubMed
MeSH terms
LinkOut - more resources
Full Text Sources
Other Literature Sources
Medical
Miscellaneous