Review
. 2011 Aug 22;278(1717):2401-11.
doi: 10.1098/rspb.2011.0604. Epub 2011 May 25.

Adaptation and habitat selection in the eco-evolutionary process

Affiliations
Review

Adaptation and habitat selection in the eco-evolutionary process

Douglas W Morris. Proc Biol Sci. .

Abstract

The struggle for existence occurs through the vital rates of population growth. This basic fact demonstrates the tight connection between ecology and evolution that defines the emerging field of eco-evolutionary dynamics. An effective synthesis of the interdependencies between ecology and evolution is grounded in six principles. The mechanics of evolution specifies the origin and rules governing traits and evolutionary strategies. Traits and evolutionary strategies achieve their selective value through their functional relationships with fitness. Function depends on the underlying structure of variation and the temporal, spatial and organizational scales of evolution. An understanding of how changes in traits and strategies occur requires conjoining ecological and evolutionary dynamics. Adaptation merges these five pillars to achieve a comprehensive understanding of ecological and evolutionary change. I demonstrate the value of this world-view with reference to the theory and practice of habitat selection. The theory allows us to assess evolutionarily stable strategies and states of habitat selection, and to draw the adaptive landscapes for habitat-selecting species. The landscapes can then be used to forecast future evolution under a variety of climate change and other scenarios.


Figures
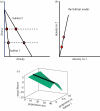
Figure 1.
Figure 1.
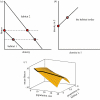
An illustration of the functional relationships between density and fitness for two habitats that produce a fixed optimum strategy of habitat selection. (a) The underlying fitness–density functions. Circles indicate densities with equal fitness in each habitat. (b) The resulting habitat isodar obtained by plotting all possible densities where fitness is equal in both habitats. (c) The map (adaptive landscape) of mean fitness for all possible strategies (proportions) of habitat occupancy at different population sizes. The maximum height of the landscape (bold black line) represents the optimum strategy of habitat selection at each population size.
Figure 2.
Figure 2.
An illustration of fitness functions that yield changing optimal strategies of density-dependent habitat selection. (a) The fitness–density functions. Circles indicate densities with equal fitness in each habitat. (b) The habitat isodar. (c) The adaptive landscape and the varying optimum habitat-selection strategy (bold black line).
Figure 3.
Figure 3.
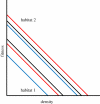
Fitness functions in two habitats for a resident strategy (black lines) and two possible mutant strategies. Mutant 1 (red lines) is a viable alternative to the resident because it trades off increased fitness in habitat 1 for reduced fitness in habitat 2. Mutant 2 (blue lines), which has the same relative trade-off, is suboptimal because its fitness at all densities is less than either of the other two strategies. The curves need not be linear or parallel.
Figure 4.
Figure 4.
An example demonstrating that the optimum strategy emerging as the weighted mean fitness in several habitats may depart substantially from the optimum strategy in any single habitat. The bold black curve and arrow signify the weighted mean fitness and weighted optimum, respectively. Coloured curves correspond to the weighted fitness functions in four different habitats. The optimum strategy in any single habitat (indicated by numbers) will often differ from the overall weighted optimum. After Cohen [69].
Figure 5.
Figure 5.
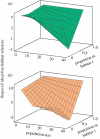
Global invader strategy landscapes for ideal-free habitat selection that corresponds with the fitness–density functions in (a) figures 1a and (b) 2b. The ideal-free distribution is evolutionarily stable.
Figure 6.
Figure 6.
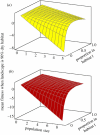
(a) Minimum and (b) maximum forecasts for future adaptive landscapes of habitat selection by brown lemmings on Herschel Island when 90% of the area is composed of xeric tundra. Forecasts are based on the 95% confidence intervals about the brown lemming's calculated isodar (Y = 0.02 + 3.42X and Y = −0.11 + 6.96X, respectively; [87]). Note differences in scale.

References

    1. Hoffmann M., et al. 2010. The impact of conservation on the status of the World's vertebrates. Science 330, 1503–150910.1126/science.1194442 (doi:10.1126/science.1194442) - DOI - DOI - PubMed
    1. Polidoro B. A., et al. 2010. The loss of species: mangrove extinction risk and geographic areas of concern. PLoS ONE 5, e10095.10.1371/journal.pone.0010095 (doi:10.1371/journal.pone.0010095) - DOI - DOI - PMC - PubMed
    1. Rands M. R. W., et al. 2010. Biodiversity conservation: challenges beyond 2010. Science 329, 1298–130310.1126/science.1189138 (doi:10.1126/science.1189138) - DOI - DOI - PubMed
    1. Pereira H. M., et al. 2010. Scenarios for global biodiversity in the 21st century. Science 330, 1496–150110.1126/science.1196624 (doi:10.1126/science.1196624) - DOI - DOI - PubMed
    1. Pörtner H. O., Farrell A. P. 2008. Physiology and climate change. Science 322, 690–69210.1126/science.1163156 (doi:10.1126/science.1163156) - DOI - DOI - PubMed