Comparative Study
. 2011 May 25;31(21):7817-30.
doi: 10.1523/JNEUROSCI.6412-10.2011.

Lysosomal proteolysis inhibition selectively disrupts axonal transport of degradative organelles and causes an Alzheimer's-like axonal dystrophy

Affiliations
Comparative Study

Lysosomal proteolysis inhibition selectively disrupts axonal transport of degradative organelles and causes an Alzheimer's-like axonal dystrophy

Sooyeon Lee et al. J Neurosci. .

Abstract

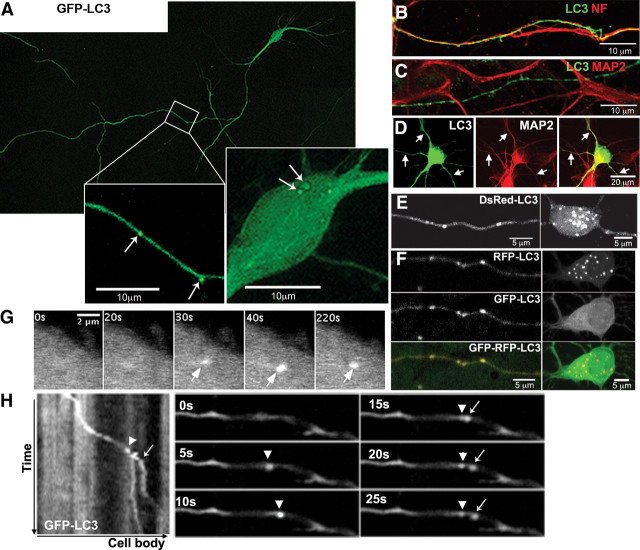
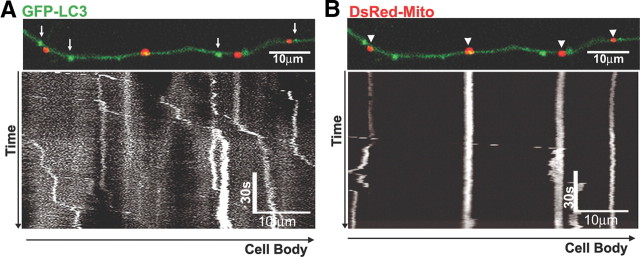
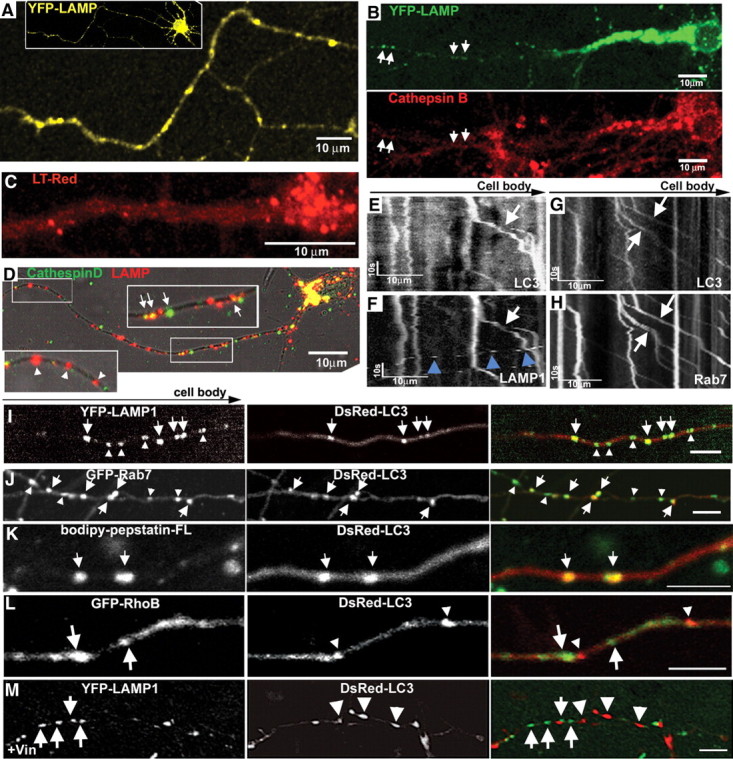
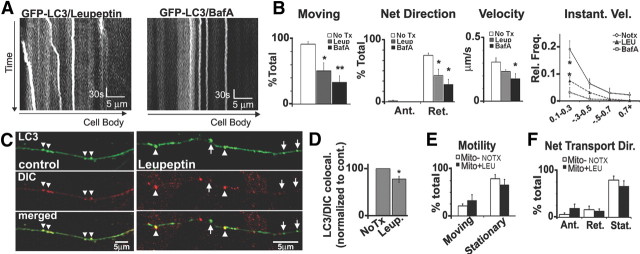
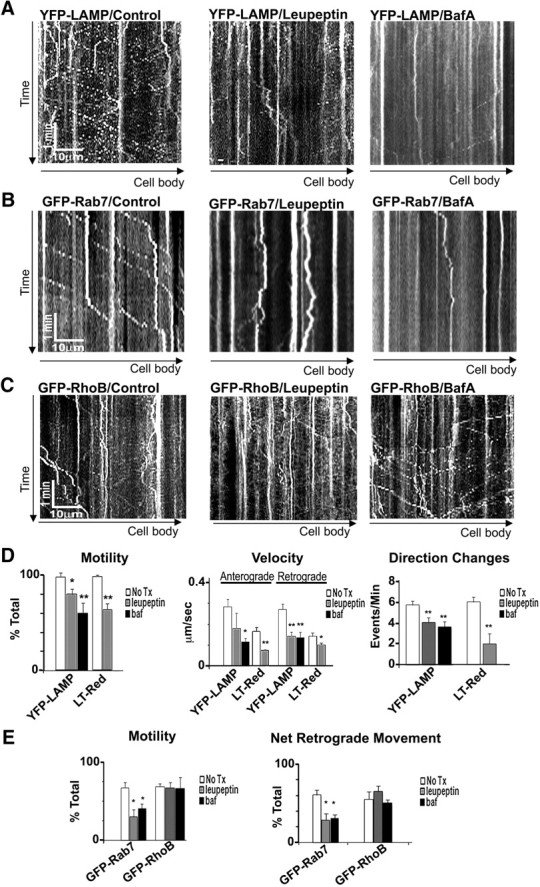
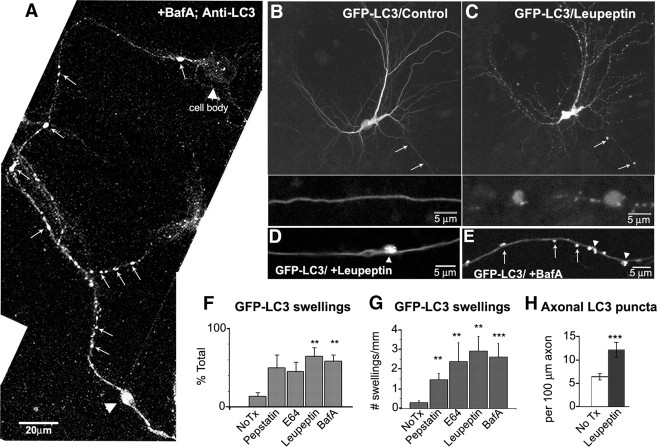
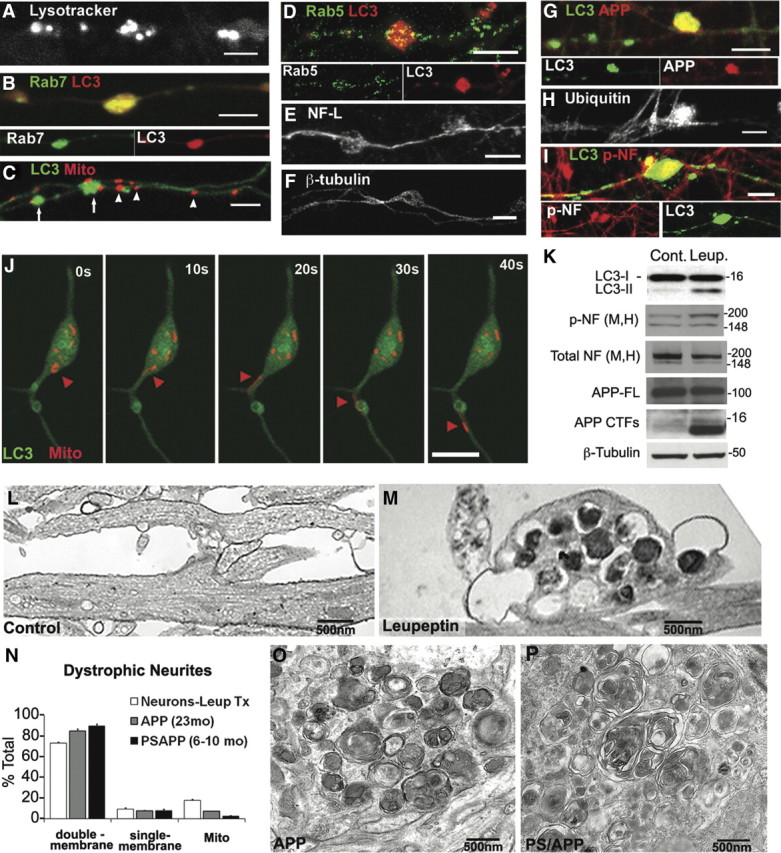
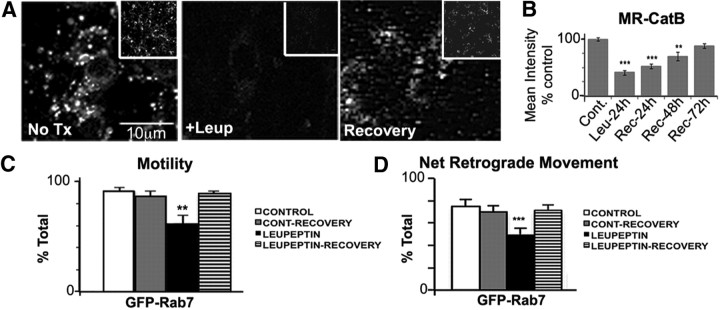
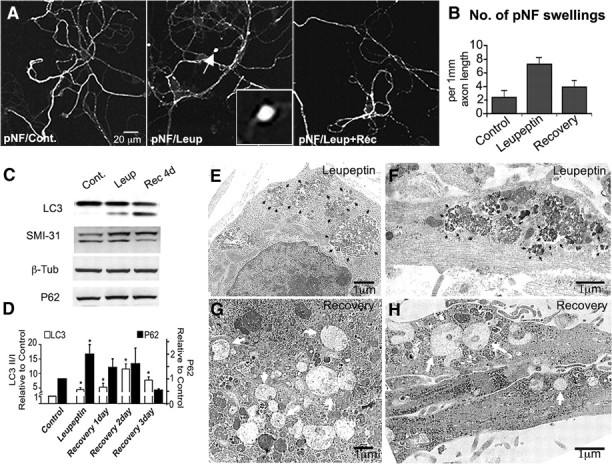
In the hallmark neuritic dystrophy of Alzheimer's disease (AD), autophagic vacuoles containing incompletely digested proteins selectively accumulate in focal axonal swellings, reflecting defects in both axonal transport and autophagy. Here, we investigated the possibility that impaired lysosomal proteolysis could be a basis for both of these defects leading to neuritic dystrophy. In living primary mouse cortical neurons expressing fluorescence-tagged markers, LC3-positive autophagosomes forming in axons rapidly acquired the endo-lysosomal markers Rab7 and LAMP1 and underwent exclusive retrograde movement. Proteolytic clearance of these transported autophagic vacuoles was initiated after fusion with bidirectionally moving lysosomes that increase in number at more proximal axon levels and in the perikaryon. Disrupting lysosomal proteolysis by either inhibiting cathepsins directly or by suppressing lysosomal acidification slowed the axonal transport of autolysosomes, late endosomes, and lysosomes and caused their selective accumulation within dystrophic axonal swellings. Mitochondria and other organelles lacking cathepsins moved normally under these conditions, indicating that the general functioning of the axonal transport system was preserved. Dystrophic swellings induced by lysosomal proteolysis inhibition resembled in composition those in several mouse models of AD and also acquired other AD-like features, including immunopositivity for ubiquitin, amyloid precursor protein, and hyperphosphorylated neurofilament proteins. Restoration of lysosomal proteolysis reversed the affected movements of proteolytic Rab7 vesicles, which in turn essentially cleared autophagic substrates and reversed the axonal dystrophy. These studies identify the AD-associated defects in neuronal lysosomal proteolysis as a possible basis for the selective transport abnormalities and highly characteristic pattern of neuritic dystrophy associated with AD.


Figures

Figure 1.
Figure 1.
Identification of axonal AVs using fluorescent LC3. A, GFP-LC3 vesicles (arrows) are detected in the cell body and in neurites. Cell body and boxed area of the neurite are enlarged. B, C, Long projections in GFP-LC3 neurons are immunoreactive for phosphorylated neurofilaments (B) but not MAP2 (C). D, Short dendrites immunoreactive for MAP2 (arrows) also express GFP-LC3. E, F, Live image of DsRed-LC3 (E) or GFP-RFP-LC3 (F) neuron, where LC3 vesicles are present in axons (left) and the cell body (right). G, Time-lapse frames of GFP-LC3 in the cell body demonstrating de novo synthesis (arrows). H, Kymograph of GFP-LC3 in axons and corresponding time-lapse frames illustrating a new LC3 vesicle (arrow) budding off an existing vesicle (arrowhead). All scale bars are as indicated.
Figure 2.
Figure 2.
LC3 vesicles primarily undergo retrograde movement. A representative live image of an axon coexpressing GFP-LC3 and DsRed-Mito is shown. LC3-positive vesicles (A, arrows) and mitochondria (B, arrowheads) do not colocalize. A 15 min kymograph of LC3 movement (A) demonstrates that LC3 undergoes predominantly retrograde movement with intermittent pausing indicated by vertical segments, whereas mitochondria (B) are frequently stationary (vertical lines), although movement occasionally occurs. All scale bars are as indicated.
Figure 3.
Figure 3.
LC3 vesicles undergo maturation during retrograde transport. A, Representative axon image from YFP-LAMP neuron. Inset, Low-magnification image of a neuron. B, YFP-LAMP double labeled with active cathepsin B marker Magic Red. Cell-body LAMP vesicles are enriched with active lysosomal cathepsin B, whereas more distal LAMP vesicles have relatively lower levels of active protease (arrows). C, LysoTracker Red vesicles are concentrated near the somatodendritic area. D, Double labeling of endogenous LAMP and cathepsin D under normal conditions. LAMP vesicles in the perinuclear area contain cathepsins (arrows). The proximal area is enlarged. E, F, Representative kymographs of DsRed-LC3 (E) and YFP-LAMP (F) movement. LC3/LAMP vesicles undergo retrograde movement (arrows), whereas LAMP vesicles not colocalized with LC3 are anterograde (F, arrowheads). G, H, Representative kymographs of DsRed-LC3 (G) and GFP-Rab7 (H) movement. LC3/Rab7 vesicles undergo retrograde movement (arrows). I, Representative axon coexpressing YFP-LAMP and DsRed-LC3. LC3 vesicles are LAMP positive (arrows). J, Representative axon coexpressing DsRed-LC3/GFP-Rab7. Most LC3 vesicles are fused with Rab7 vesicles (arrows), whereas a subset of Rab7 vesicles are not colocalized with LC3 (arrowheads). K, Representative DsRed-LC3 vesicles double labeled with active cathepsin D marker Bodipy-pepstatin-FL. LC3 vesicles contain active cathepsin D. L, Representative axon coexpressing GFP-RhoB and DsRed-LC3. DsRed-LC3 vesicles (arrowheads) do not colocalize with GFP-RhoB (arrows). M, Vinblastine treatment (1 μm, 1 h) prevents colocalization between LC3 and LAMP vesicles. Scale bars: I–M, 5 μm, or as indicated.
Figure 4.
Figure 4.
Lysosomal proteolysis inhibition slows LC3 vesicle transport without causing generalized axonal transport defects. A, Representative 5 min kymographs of GFP-LC3 movies after leupeptin (20 μm, 24 h) or bafilomycin A (10 nm, 2 h; compared with controls) (see Fig. 2A). B, Quantification of GFP-LC3 movements after leupeptin (n = 81 vesicles), bafilomycin A (n = 44 vesicles), or controls (n = 96 vesicles). The percentage of moving LC3 vesicles (motility) and LC3 vesicles undergoing net retrograde movement are significantly reduced by leupeptin or bafilomycin treatment. LC3 vesicles also have slower retrograde velocities after leupeptin or bafilomycin, and the frequency of instantaneous retrograde velocities show a depression after leupeptin or bafilomycin. C, DIC immunolabeling on GFP-LC3 vesicles under normal conditions and after treatment with leupeptin. A portion of LC3 vesicles did not colocalize with DIC after leupeptin (arrowheads). D, Quantification of the percentage of LC3 vesicles that colocalized with DIC (per axon) shows reduction after leupeptin (n = 60). E, F, Motility (E) and net direction (F) of DsRed-Mito-positive mitochondria (control, n = 69; leupeptin, n = 78) show that mitochondria movements were not affected by leupeptin (20 μm, 24 h). Values represents means ± SEM. *p < 0.05; **p < 0.01. No Tx, No treatment; BafA, bafilomycin A; Leup or LEU, leupeptin.
Figure 5.
Figure 5.
Lysosomal proteolysis inhibition slows endo-lysosome transport. A–C, Representative 5 min kymographs of YFP-LAMP (A), GFP-Rab7 (B), and GFP-RhoB (C) after leupeptin (20 μm, 24 h) or bafilomycin A (10 nm, 2 h) compared with controls. D, Quantification of YPF-LAMP and LysoTracker Red (LT-Red) vesicle motility, net transport direction, and frequency of direction changes (YFP-LAMP: control, n = 82 vesicles; leupeptin, n = 68 vesicles; bafilomycin, n = 44; LT-Red: control, n = 62 vesicles; leupeptin, n = 71 vesicles; see Materials and Methods for details). Both leupeptin and bafilomycin significantly reduce the percentage of moving LAMP/LT vesicles, reduce anterograde and retrograde net movements, and decrease the frequency of direction changes. E, Quantification of GFP-Rab7 and GFP-RhoB movements after leupeptin (Rab7, n = 66 vesicles; RhoB, n = 54 vesicles), bafilomycin A (Rab7, n = 94 vesicles; RhoB, n = 43 vesicles), or controls (Rab7, n = 109 vesicles; RhoB, n = 54). Leupeptin and bafilomycin A reduce the percentage of moving vesicles and the retrograde transport of Rab7 without affecting the retrograde transport of RhoB. Values represents means ± SEM. *p < 0.05; **p < 0.01. No Tx, No treatment; BafA or baf, bafilomycin A.
Figure 6.
Figure 6.
Lysosomal proteolysis inhibition accumulates LC3 vesicles. A, Endogenous LC3-immunoreactive vesicles (arrows) are abundant and accumulated (arrowhead) after treatment with bafilomycin (10 nm, 4 h). The cell body contains relatively few LC3 puncta compared with the axon. B, C, Representative live image of GFP-LC3 neuron before (B) or after (C) treatment with leupeptin (20 μm, 24 h). LC3 vesicles accumulate in swellings (arrows). The enlarged area of axonal swellings is shown below. D, E, Live image of axonal GFP-LC3 vesicles after treatment with leupeptin (20–40 μm, 24 h; D) or bafilomycin A (50 nm, 4 h; E) where vesicles are both dispersed (arrows) and accumulated in a focal swelling (arrowhead). F, Quantification of the percentage of GFP-LC3 neurons with neuritic swellings containing GFP-LC3. G, The number of GFP-LC3 vesicle-enriched swellings per millimeter length of neurite after treatment with various protease inhibitors (see Materials and Methods). H, Quantification of the number of GFP-LC3 vesicles per 100 μm in control or after leupeptin treatment (n = 50). The frequency of GFP-LC3 vesicles increases ∼2.5-fold after leupeptin. Values represents means ± SEM. All scale bars are as indicated. **p < 0.01; ***p < 0.0001. No Tx, No treatment; BafA, bafilomycin A.
Figure 7.
Figure 7.
Biochemical and ultrastructural profiles of neurites after lysosomal clearance inhibition resemble AD dystrophic neurites. A–F, Swellings preferentially accumulate with lysosomal (proteolytic) vesicles after treatment with leupeptin (20 μm, 24 h). LysoTracker Red vesicles (A), Rab7 vesicles (B), and LC3 vesicles (C, arrows) are preferentially accumulated, whereas mitochondria (C, arrowheads), Rab5-positive early endosomes (D), neurofilament-light chain (E), or β-tubulin (F) are relatively evenly distributed along the axon. G–I, Swellings accumulate proteins that identify AD-dystrophic neurites including APP-containing autophagic vesicles (G; C1/6.1 antibody for C terminus of APP double labeled with LC3), ubiquitinated proteins (H), and phospho-neurofilaments (I; NF-M/H; double labeled with LC3). Phosphorylated neurofilament accumulation occurs in swollen regions containing accumulated LC3 vesicles. Scale bars, 5 μm. J, Time lapse of swelling with GFP-LC3 and DsRed-Mito cotransfection and treatment with leupeptin (20 μm, 5 h). The cell body is at the top. Although both GFP-LC3 vesicles and DsRed-mitochondria are accumulated, mitochondria occasionally resume transport (red arrowheads), whereas LC3 movement out from the swelling is not observed. K, Western blots with indicated antibodies in leupeptin-treated neurons compared with controls. Leupeptin increases the ratio of LC3-II/I, phospho-neurofilaments (SMI-31), and APP-CTFs, without increasing overall levels of neurofilaments or APP holoprotein (full length). Molecular mass is shown in kilodaltons. L, M, Representative electron micrographs of neurites after leupeptin (20 μm, 24 h; M) compared with controls (L). Leupeptin-induced accumulation of double-membrane, amorphous electron-dense AVs in neurites is shown. N, Quantification of morphometric analysis of organelles in dystrophic neurites from leupeptin-treated neurons (Leup Tx; n = 20) or AD mouse models (APP, n = 25; PSAPP, n = 25). O, P, Representative electron micrographs of dystrophic neurites from APP (O) and PSAPP (P) mouse brain. Organelles within dystrophic neurites are mostly double-membrane AVs. Values represents means ± SEM. Scale bars: A–J, 5 μm.
Figure 8.
Figure 8.
Recovery of lysosomal proteolysis restores transport of GFP-Rab7-positive late endosomes and autolysosomes. A, Active cathepsin B (Magic Red) is severely reduced by leupeptin treatment (20 μm, 24 h) but restored after recovery for 3 d in normal medium. B, Quantification of Magic Red cathepsin B loading in A. Values represent mean intensity. C, Quantification of GFP-Rab7 movements after leupeptin (n = 55 vesicles), or 24 h recovery after leupeptin (leupeptin recovery; n = 119) compared with untreated controls (n = 101 vesicles) and recovery controls (normal medium replacement without leupeptin treatment; n = 119 vesicles). D, Leupeptin recovery restores the percentage of moving vesicles and the retrograde transport of GFP-Rab7 vesicles (C, D). Values represents means ± SEM. *p < 0.05; **p < 0.01; ***p < 0.001.
Figure 9.
Figure 9.
Recovery of lysosomal proteolysis reverses axonal dystrophies and enhances maturation of accumulated AVs. A, Phosphorylated neurofilament immunofluorescence using SMI-31 antibody in neurons after leupeptin (20 μm, 24 h) followed by 24 h in normal medium. B, Quantification of the number of SMI-31-enriched swellings per 103 μm axon length after leupeptin recovery is similar to controls (number of 40× fields quantified: n = 29 control; n = 26 leupeptin; n = 33 recovery). C, Western blots of LC3, phosphorylated neurofilaments (SMI-31), β-tubulin (β-Tub), and P62 in leupeptin (Leup) and leupeptin-recovery (Rec 4d) neurons compared with untreated neurons. Cont., Control. D, Quantification of LC3 and P62 Western blot densitometry for leupeptin-treated and leupeptin-recovered neurons for 1–4 d. n = 4 for each treatment. E, F, Representative ultrastructural images of AVs accumulated in the cell body (E) or neurites (F) after leupeptin treatment (20 μm, 24 h). AVs are filled with undegraded electron-dense material (black arrowheads). G, H, Representative ultrastructural images of AVs in the cell body (G) or neurites (H) after 4 d of recovery in normal medium after 24 h leupeptin treatment (20 μm). Most AVs in the cell body and neurites have a clear lumen (white arrows). Values represents means ± SEM. *p < 0.05; **p < 0.01; ***p < 0.001.

References

    1. Adalbert R, Nogradi A, Babetto E, Janeckova L, Walker SA, Kerschensteiner M, Misgeld T, Coleman MP. Severely dystrophic axons at amyloid plaques remain continuous and connected to viable cell bodies. Brain. 2009;132:402–416. - PubMed
    1. Bahr BA, Bendiske J. The neuropathogenic contributions of lysosomal dysfunction. J Neurochem. 2002;83:481–489. - PubMed
    1. Bains M, Heidenreich KA. Live-cell imaging of autophagy induction and autophagosome-lysosome fusion in primary cultured neurons. Methods Enzymol. 2009;453:145–158. - PMC - PubMed
    1. Ballabio A, Gieselmann V. Lysosomal disorders: from storage to cellular damage. Biochim Biophys Acta. 2009;1793:684–696. - PubMed
    1. Bampton ETW, Goemans CG, Niranjan D, Mizushima N, Tolkovsky AM. The dymanics of autophagy visualizes in live cells: from autophagosome formation to fusion with endo/lysosomes. Autophagy. 2005;1:23–36. - PubMed

Publication types

Substances