Comparative Study
. 2011 May 25;31(21):7831-9.
doi: 10.1523/JNEUROSCI.0839-11.2011.

Evidence for reduced experience-dependent dendritic spine plasticity in the aging prefrontal cortex

Affiliations
Comparative Study

Evidence for reduced experience-dependent dendritic spine plasticity in the aging prefrontal cortex

Erik B Bloss et al. J Neurosci. .

Abstract

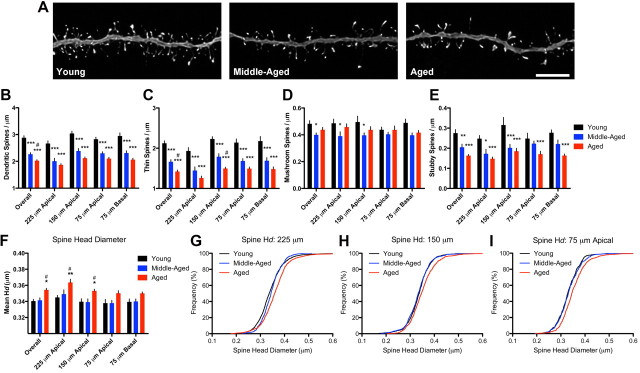
Cognitive functions that require the prefrontal cortex are highly sensitive to aging in humans, nonhuman primates, and rodents, although the neurobiological correlates of this vulnerability remain largely unknown. It has been proposed that dendritic spines represent the primary site of structural plasticity in the adult brain, and recent data have supported the hypothesis that aging is associated with alterations of dendritic spine morphology and plasticity in prefrontal cortex. However, no study to date has directly examined whether aging alters the capacity for experience-dependent spine plasticity in aging prefrontal neurons. To address this possibility, we used young, middle-aged, and aged rats in a behavioral stress paradigm known to produce spine remodeling in prefrontal cortical neurons. In young rats, stress resulted in dendritic spine loss and altered patterns of spine morphology; in contrast, spines from middle-aged and aged animals were remarkably stable and did not show evidence of remodeling. The loss of stress-induced spine plasticity observed in aging rats occurred alongside robust age-related reductions in spine density and shifts in remaining spine morphology. Together, the data presented here provide the first evidence that experience-dependent spine plasticity is altered by aging in prefrontal cortex, and support a model in which dendritic spines become progressively less plastic in the aging brain.


Figures

Figure 1.
Figure 1.
Spine sampling and reconstructions. A, B, Layer III PL neurons were ionophoretically labeled with Lucifer yellow (A) and systematically sampled at 75 μm intervals in the apical and basal tree (B). C–E, Raw confocal laser scanning microscopy images were acquired (C), deconvolved to improve resolution and remove the point spread along the z-axis (D), and analyzed using a custom-built NeuronStudio software package (E). F, High-resolution example of dendritic spine analysis. Circles of all colors, maximum head diameter measures; yellow circles, thin spines; orange circles, mushroom spines; pink, stubby spines. See Materials and Methods for details. Scale bars: A, B (in B), 75 μm; C–F, 5 μm.
Figure 2.
Figure 2.
Stress-induced dendritic spine plasticity on neurons from young animals. A, Representative dendritic segments from control (left), stress (center), and recovery (right) neurons from young animals. Scale bar, 5 μm. B, Three weeks of stress exposure was associated with reductions in spine density throughout the apical, but not basal, tree; spine density was reduced on recovery neurons when collapsed across all dendritic distances, but not when analyzed separately. C, D, Stress was associated with mild decreases in thin spine density (C), whereas mushroom spine densities were not changed by stress exposure (D). E, Stress resulted in significant decreases in stubby spine density, specifically at 150 μm from the soma in the apical tree. F, Stress did not alter mean spine head diameter (Hd). G, Individual head diameter frequencies were shifted to the right at 225 μm from soma in both stress and recovery spines compared with controls. Bar graphs represent the group mean ± SEM. H, I, Spines at 150 and 75 μm were unaffected. *p < 0.05, **p < 0.005, and ***p < 0.0001 compared with controls. See Results for details.
Figure 3.
Figure 3.
Spine stability on middle-aged neurons. A, Representative dendritic segments from control (left), stress (center), and recovery (right) neurons from middle-aged animals. Scale bar, 5 μm. B, In contrast to neurons from young animals, stress exposure did not alter spine density in middle-aged neurons. C–F, Thin (C), mushroom (D), and stubby (E) spine densities and mean spine head diameters (F) were unaltered by stress or recovery. Bar graphs represent the group mean ± SEM. G, H, Individual head diameter (Hd) frequency distributions at 225 μm (G) from soma showed minor differences between control and recovery animals, whereas frequency distributions at 150 μm (H) were significantly different between stress and recovery animals. I, Spines at 75 μm in the apical tree were indistinguishable by group.
Figure 4.
Figure 4.
Spine stability on aged neurons. A, Representative dendritic segments from control (left), stress (center), and recovery (right) neurons from aged animals. Scale bar, 5 μm. B, Similar to middle-aged neurons, stress exposure did not alter spine density in aged neurons. C–F, Thin (C), mushroom (D), and stubby (E) spine densities and mean spine head diameters (F) were unaltered by stress or recovery. Bar graphs represent the group mean ± SEM. G–I, Individual head diameter (Hd) frequency distributions at 225 (G), 150 (H), and 75 (I) μm from soma on the apical tree were unaffected by stress or recovery.
Figure 5.
Figure 5.
Changes in spine density and morphology on aging control neurons. A, Representative dendritic segments from young control (left), middle-aged control (center), and aged control (right) animals. Scale bar, 5 μm. B, Robust decreases in spine density were found across all aging control neurons. C, Thin spine densities were progressively decreased across the dendritic tree with age. D, Mushroom spine densities were decreased at distal segments in middle-aged compared with young neurons, but otherwise remained stable between young and aged animals. E, Like thin spines, stubby spine densities progressively decreased across the dendritic tree with age. F, Aging was associated with significant increases in mean spine head diameter overall and specifically in distal apical segments of aged, but not middle-aged, animals. Bar graphs represent the group mean ± SEM. G–I, Individual head diameter (Hd) frequency distributions were significantly shifted to the right at all apical distances in aged spines relative to both young and middle-aged spines. *p < 0.05, **p < 0.005, and ***p < 0.0001 compared with young. #p < 0.05 compared with middle-aged. See Results for details.

References

    1. Bhatt DH, Zhang S, Gan WB. Dendritic spine dynamics. Annu Rev Physiol. 2009;71:261–282. - PubMed
    1. Bizon JL, Helm KA, Han JS, Chun HJ, Pucilowska J, Lund PK, Gallagher M. Hypothalamic-pituitary-adrenal axis function and corticosterone receptor expression in behaviourally characterized young and aged Long–Evans rats. Eur J Neurosci. 2001;14:1739–1751. - PubMed
    1. Bizon JL, LaSarge CL, Montgomery KS, McDermott AN, Setlow B, Griffith WH. Spatial reference and working memory across the lifespan of male Fischer 344 rats. Neurobiol Aging. 2009;30:646–655. - PMC - PubMed
    1. Bloss EB, Janssen WG, McEwen BS, Morrison JH. Interactive effects of stress and aging on structural plasticity in the prefrontal cortex. J Neurosci. 2010;30:6726–6731. - PMC - PubMed
    1. Brennan AR, Yuan P, Dickstein DL, Rocher AB, Hof PR, Manji H, Arnsten AF. Protein kinase C activity is associated with prefrontal cortical decline in aging. Neurobiol Aging. 2009;30:782–792. - PMC - PubMed

Publication types