. 2011 Jul 15;22(14):2588-600.
doi: 10.1091/mbc.E11-04-0362. Epub 2011 May 25.

Phosphatidylinositol-(4,5)-bisphosphate regulates clathrin-coated pit initiation, stabilization, and size

Affiliations

Phosphatidylinositol-(4,5)-bisphosphate regulates clathrin-coated pit initiation, stabilization, and size

Costin N Antonescu et al. Mol Biol Cell. .

Abstract

Clathrin-mediated endocytosis (CME) is the major mechanism for internalization in mammalian cells. CME initiates by recruitment of adaptors and clathrin to form clathrin-coated pits (CCPs). Nearly half of nascent CCPs abort, whereas others are stabilized by unknown mechanisms and undergo further maturation before pinching off to form clathrin-coated vesicles (CCVs). Phosphatidylinositol-(4,5)-bisphosphate (PIP(2)), the main lipid binding partner of endocytic proteins, is required for CCP assembly, but little is currently known about its contribution(s) to later events in CCV formation. Using small interfering RNA (siRNA) knockdown and overexpression, we have analyzed the effects of manipulating PIP(2) synthesis and turnover on CME by quantitative total internal reflection fluorescence microscopy and computational analysis. Phosphatidylinositol-4-phosphate-5-kinase cannot be detected within CCPs but functions in initiation and controls the rate and extent of CCP growth. In contrast, the 5'-inositol phosphatase synaptojanin 1 localizes to CCPs and controls early stabilization and maturation efficiency. Together these results suggest that the balance of PIP(2) synthesis in the bulk plasma membrane and its local turnover within CCPs control multiple stages of CCV formation.


Figures

FIGURE 1:
FIGURE 1:
PIP5K isoforms cannot be detected in CCPs. BSC-1 cells stably expressing eGFP-CLC were transfected with cDNA encoding mCherry-PIP5Kα, mCherry-PIP5Kβ, mCherry-PIP5Kγ, or mCherry alone. Their dynamic localization to CCPs was detected by time-lapse TIRF microscopy. (A) Shown are representative single-frame fluorescence micrographs (also see Supplemental Movies 1–4). Scale bar, 5 μm. (B) Shown is the mean fluorescence intensity corresponding to mCherry-PIP5Kα, -PIP5Kβ, or -PIP5Kγ throughout CCP lifetimes within CCP tracks (alongside that of mCherry alone) grouped into 10–20 s (left panel) or 60–80 s (right panel) lifetime cohorts. Also shown is the mean fluorescence intensity of eGFP-CLC within these CCP tracks (note different scale). Error bars reflect cell-to-cell variation. The number of CCP trajectories (n) and cells (k) for each condition are control mCherry: n = 63,603, k = 50; mCherry-PIP5Kα: n = 74,685, k = 37; mCherry-PIP5Kβ: n = 62,130, k = 38; and mCherry-PIP5Kγ: n = 60,853, k = 33.
FIGURE 2:
FIGURE 2:
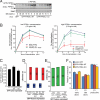
Controlled PIP5Kα overexpression reduces Tfn internalization yet increases CCP initiation. BSC-1 cells stably expressing mCherry-CLC were infected with adenoviruses encoding tet-regulated WT or KD eGFP-PIP5Kα or eGFP alone, and were cultured in the presence of various concentrations of tet. (A) Shown are representative immunoblots with anti-PIP5Kα. (B) Tfn uptake was determined in BSC-1 cells expressing either WT or KD PIP5Kα or GFP alone (control) at either 15 ng/ml (low overexpression) or 2.5 ng/ml (high overexpression) tet. Shown are the means of at least three independent experiments. (C–F) The results of TIRF microscopy imaging and CCP lifetime decomposition in cells infected with adenoviruses as indicated at 15 ng/ml tet are shown: (C) CCP initiation rate, lifetimes of abortive (D) and productive (E) CCP subpopulations, and (F) relative contributions of CCP subpopulations. Error bars, cell-to-cell variation; the length of the lifetime bars in (D) and (E) denotes the t50 spread of the distribution. The number of CCP trajectories (n) and cells (k) for each condition are control eGFP: n = 185,683, k = 73; eGFP-PIP5Kα WT: n = 177,504, k = 57; and eGFP-PI5K1α KD: n = 87,597, k = 38. (B and C) *p < 0.05. (D–F) *p < 10−8.
FIGURE 3:
FIGURE 3:
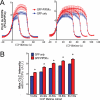
PIP5Kα overexpression increases CCP size. BSC-1 cells stably expressing mCherry-CLC were infected with adenoviruses encoding tet-regulated WT eGFP-PIP5Kα or eGFP alone, and were cultured in the presence of 15 ng/ml tet (low PIP5Kα overexpression). Shown is the mean mCherry-CLC (clathrin) fluorescence intensity throughout CCP lifetimes (A) or maximal mCherry-CLC in each CCP track (B), grouped into lifetime cohorts. Error bars reflect cell-to-cell variation. The number of CCP trajectories (n) and cells (k) for each condition are control eGFP: n = 185,683, k = 73; eGFP-PIP5Kα WT: n = 177,504, k = 57; and eGFP-PI5K1α KD: n = 87,597, k = 38. (B and C) *p < 0.05. (C, E, and F) *p < 10−8.
FIGURE 4:
FIGURE 4:
siRNA knockdown of PIP5Kα reduces CCP maturation efficiency and CCP size. BSC-1 cells stably expressing eGFP-CLC were treated with PIP5Kα-specific or nontargeting (control) siRNA. (A) Shown are the means of at least three independent experiments for detection of PIP5Kα mRNA levels and a representative immunoblot with PIP5Kα-specific or CHC-specific (loading control) antibodies. The results of TIRF microscopy imaging and CCP lifetime decomposition in cells treated with siRNAs as indicated are shown: (B) CCP initiation rate lifetimes of (C) abortive and (D) productive CCP subpopulations and (E) relative contributions of CCP subpopulations. The length of the lifetime bars in (C) and (D) denotes the t50 spread of the distribution. (F) Mean maximal eGFP-CLC intensity within CCP tracks grouped into lifetime cohorts was determined in cells treated as indicated. Error bars reflect cell-to-cell variation. The number of CCP trajectories (n) and cells (k) for each condition are control siRNA: n = 102,059, k = 81; and PIP5Kα siRNA: n = 30,828, k = 34. (A, B, and F) *p < 0.05. (C–E) *p < 10−8.
FIGURE 5:
FIGURE 5:
Sjn1 is the major 5′-inositol phosphatase within CCPs. BSC-1 cells stably expressing eGFP-CLC were transfected with cDNA encoding mCherry-Sjn1, mCherry-OCRL, mCherry-Sjn2, or mCherry alone. (A) Representative single-frame fluorescence micrographs acquired by TIRF microscopy are shown (also see Supplemental Movies 5–7). Scale bar, 5 μm. (B) CCP tracks with detectable mCherry-tagged phosphatases were computationally identified as described in Materials and Methods. Shown is the mean percentage of CCPs positive for each mCherry-tagged phosphatase. (C) Shown is the mean normalized fluorescence corresponding to eGFP-CLC or mCherry-Sjn1 in distinct CCP lifetime cohorts. Error bars represent cell-to-cell variation. The number of CCP trajectories (n) and cells (k) for each condition are control mCherry: n = 209,738, k = 78; mCherry-Sjn1 170: n = 80,709, k = 45; mCherry-OCRLa: n = 137,307, k = 29; mCherry-Sjn2: n = 73,871, k = 31.
FIGURE 6:
FIGURE 6:
Controlled overexpression of Sjn1–170 impacts CCP stabilization, abortive turnover, and maturation. BSC-1 cells stably expressing mCherry-CLC were infected with adenoviruses encoding tet-regulated WT or PD eGFP-Sjn1 or eGFP alone and cultured in the presence of various concentrations of tet. (A) Shown is a representative immunoblot with anti-GFP antibodies to detect GFP-Sjn1 expression. (B) Tfn uptake was determined in BSC-1 cells expressing either WT or PD Sjn1–170 or GFP alone (control) at either 15 ng/ml (low overexpression) or 5 ng/ml (high overexpression) tet. Shown are the means of at least three independent experiments. (C–F) The results of TIRF microscopy imaging and CCP lifetime decomposition in cells infected with adenoviruses at 15 ng/ml tet as indicated are shown: (C) CCP initiation rate, lifetimes of (D) abortive and (E) productive CCP subpopulations, and (F) relative contributions of CCP subpopulations. Error bars reflect cell-to-cell variation; the length of the lifetime bars in (D) and (E) denotes the t50 spread of the distribution. The number of CCP trajectories (n) and cells (k) for each condition are control GFP: n = 185,683, k = 73; eGFP-Sjn1 170 WT: n = 85,212, k = 34; eGFP-Sjn1 170 PD: n = 44,651, k = 26. (B and C) *p < 0.05. (D–F) *p < 10−8.
FIGURE 7:
FIGURE 7:
siRNA knockdown of Sjn1 enhances CCP maturation efficiency, delays the turnover of abortive CCPs, and increases the lifetime of productive CCPs. BSC-1 cells stably expressing eGFP-CLC were treated with either Sjn1-specific or nontargeting siRNA. (A) Shown are the means of at least five independent experiments for detection of Sjn1 mRNA levels. The results of TIRF microscopy imaging and CCP lifetime decomposition in cells treated with siRNAs as indicated are shown: (B) CCP initiation rate, lifetimes of (C) abortive and (D) productive CCP subpopulations, and (E) relative contributions of CCP subpopulations. (F) Mean maximal eGFP-CLC (clathrin) fluorescence intensity within CCP tracks grouped into lifetime cohorts was determined in cells treated as indicated. Error bars reflect cell-to-cell variation; the length of the lifetime bars in (C) and (D) denotes the t50 spread of the distribution. The number of CCP trajectories (n) and cells (k) for each condition are control siRNA: n = 10,259, k = 81; and Sjn1 siRNA: n = 42,649, k = 33. (A) *p < 0.05. (C–E) *p < 10−8.
FIGURE 8:
FIGURE 8:
Diagram depicting temporal regulation of CCP formation by PIP5K and Sjn1. Stages of CCP formation (initiation, assembly/growth, which leads to stabilization, maturation, and scission/uncoating). Dotted line indicates the proposed endocytic checkpoint that gates progression toward CCV formation. Positive (green) and negative (red) regulation by PI5K and Sjn1 at each stage is also shown. See Discussion for details.

References

    1. Abe N, Inoue T, Galvez T, Klein L, Meyer T. Dissecting the role of PtdIns(4,5)P2 in endocytosis and recycling of the transferrin receptor. J Cell Sci. 2008;121:1488–1494. - PMC - PubMed
    1. Antonescu CN, Danuser G, Schmid SL. Phosphatidic acid plays a regulatory role in clathrin-mediated endocytosis. Mol Biol Cell. 2010;21:2944–2952. - PMC - PubMed
    1. Bairstow SF, Ling K, Su X, Firestone AJ, Carbonara C, Anderson RA. Type Iγ661 phosphatidylinositol phosphate kinase directly interacts with AP2 and regulates endocytosis. J Biol Chem. 2006;281:20632–20642. - PubMed
    1. Barbieri MA, Heath CM, Peters EM, Wells A, Davis JN, Stahl PD. Phosphatidylinositol-4-phosphate 5-kinase-1beta is essential for epidermal growth factor receptor-mediated endocytosis. J Biol Chem. 2001;276:47212–47216. - PubMed
    1. Botelho RJ, Teruel M, Dierckman R, Anderson R, Wells A, York JD, Meyer T, Grinstein S. Localized biphasic changes in phosphatidylinositol-4,5-bisphosphate at sites of phagocytosis. J Cell Biol. 2000;151:1353–1368. - PMC - PubMed

Publication types

MeSH terms

Substances

LinkOut - more resources