. 2011 Jun 14;108(24):9857-62.
doi: 10.1073/pnas.1019003108. Epub 2011 May 25.

Calcium-dependent dynamics of cadherin interactions at cell-cell junctions

Affiliations

Calcium-dependent dynamics of cadherin interactions at cell-cell junctions

Sally A Kim et al. Proc Natl Acad Sci U S A. .

Abstract

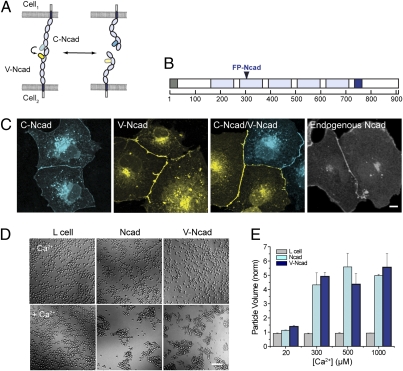
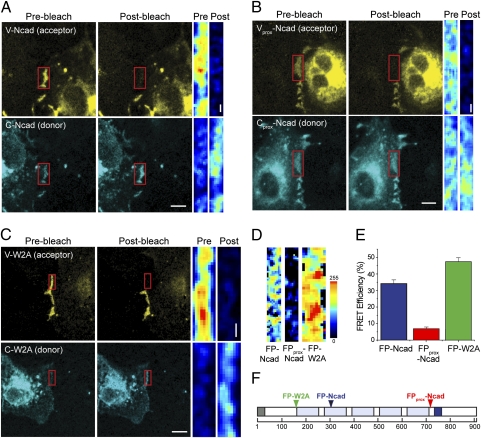
Cadherins play a key role in the dynamics of cell-cell contact formation and remodeling of junctions and tissues. Cadherin-cadherin interactions are gated by extracellular Ca(2+), which serves to rigidify the cadherin extracellular domains and promote trans junctional interactions. Here we describe the direct visualization and quantification of spatiotemporal dynamics of N-cadherin interactions across intercellular junctions in living cells using a genetically encodable FRET reporter system. Direct measurements of transjunctional cadherin interactions revealed a sudden, but partial, loss of homophilic interactions (τ = 1.17 ± 0.06 s(-1)) upon chelation of extracellular Ca(2+). A cadherin mutant with reduced adhesive activity (W2A) exhibited a faster, more substantial loss of homophilic interactions (τ = 0.86 ± 0.02 s(-1)), suggesting two types of native cadherin interactions--one that is rapidly modulated by changes in extracellular Ca(2+) and another with relatively stable adhesive activity that is Ca(2+) independent. The Ca(2+)-sensitive dynamics of cadherin interactions were transmitted to the cell interior where β-catenin translocated to N-cadherin at the junction in both cells. These data indicate that cadherins can rapidly convey dynamic information about the extracellular environment to both cells that comprise a junction.


Conflict of interest statement

The authors declare no conflict of interest.

Figures

Fig. 1.
Fig. 1.
Design and characterization of N-cadherin FRET reporter. (A) Schematic of N-cadherin–N-cadherin interactions at cell–cell junctions monitored by FRET. Light blue ovals represent the five EC domains; the inserted fluorescent protein, Venus (yellow) or Cerulean (cyan), is located in the EC2 domain. Dynamic interactions of cadherins monitored by FRET result in intensity changes of each fluorescent protein. (B) Domain structure of fluorescent protein insertion site in N-cadherin (gray, signal peptide; light blue, EC domains; dark blue, transmembrane domain; blue arrow, FP insertion site). Amino acid numbers are indicated below the bar. (C) N-cadherin fusion proteins. Cerulean (Left), Venus (Center Left), and Cerulean/Venus (Center Right) localize to the membrane and form cell–cell contacts similar to the localization of endogenous Ncad (Right) in COS-7 cells. (Scale bar: 10 μm.) (D) L-cells expressing Ncad or V-Ncad constructs show robust cell aggregation under high Ca2+ (1 mM Ca2+). (Scale bar: 50 μm.) (E) Ncad and V-Ncad stable cell lines show similar and increasing aggregation with increasing extracellular Ca2+ concentrations. No statistically significant differences (Student t test; P < 0.05) were seen at higher Ca2+ concentrations (300–1,000 μM). Error bars indicate ± SEM for n = 3–4 for each condition. Untransfected L-cells showed no aggregation under any conditions.
Fig. 2.
Fig. 2.
Detecting N-cadherin interactions under basal conditions across cell–cell junctions. A representative example of a cell–cell junction of two adjacent transfected COS-7 cells expressing (A) V-Ncad or C-Ncad, (B) Vprox-Ncad or Cprox-Ncad, and (C) V-W2A or C-W2A fusion proteins under basal high Ca2+ conditions (1.8 mM Ca2+). The acceptor (Venus fusion protein) was bleached within the ROI (red box); images were acquired before and after bleaching (see D for color look-up table). (Scale bars: images, 10 μm; corresponding ROIs, 1 μm.) (D) Quantitative spatial FRET maps for each of the examples shown in A–C, respectively, show the heterogeneity of cadherin interactions at cell–cell contact. (Scale bar: same as for corresponding ROIs in C.) (E) Average FRET efficiencies for WT, W2A, and WTprox N-cadherin junctions. Error bars indicate ± SEM for n = 10 cells each. (F) N-cadherin domain structure indicating the W2A mutation (green; FP-W2A), and distal (blue; FP-Ncad) and proximal (red; FPprox-Ncad) insertion sites for FRET reporter constructs.
Fig. 3.
Fig. 3.
N-cadherin interactions across junctions exhibit a rapid sensitivity to extracellular Ca2+ changes. (A) Images of COS-7 cells expressing either FP-Ncad or FP-W2A fluorescent fusion proteins of the FRET reporter. ROIs (red boxes) were chosen encompassing well-defined junctions for faster acquisition. ROIs were colorized according to the emission ratio of V-Ncad:C-Ncad fluorescence intensity (V/C ratio). (Scale bar: 10 μm.) (B) Quantitation of Ca2+-dependent cadherin FRET changes over time. ROIs (red boxes in A) at two-color junctions were imaged before and after the addition of the Ca2+ chelator, EGTA (20 mM final), at 15 s (gray arrow). The fluorescence intensity of each channel was normalized to the average baseline (yellow for V-Ncad and cyan for C-Ncad) and plotted together with the V/C ratio as a measure of FRET (red). (C) Representative emission spectra of a two-color FP-Ncad junction before and after EGTA treatment. (D and F) Kinetics of the FRET decrease upon Ca2+ removal. EGTA was added at 15 s (see gray arrow; FP-Ncad (D) and FP-W2A (F); n = 17 each; mean ± SEM). Data were fit with a single exponential decay curve (red). (E) Summary of the magnitude of FRET changes upon Ca2+ depletion in FP-Ncad and FP-W2A junctions (n = 17 each; P < 0.0001).
Fig. 4.
Fig. 4.
Extracellular Ca2+ chelation results in a translocation of β-catenin to the membrane. β-catenin-GFP is expressed in two neighboring cells in either COS-7 cells with endogenous N-cadherin (A) or in L-cells in the absence of N-cadherin (B). Cells were imaged every 1 s before and after the addition of the Ca2+ chelator EGTA at 30 s (A and B Upper). An ROI (red box) of the junctions (A and B Right) shows pre- and post-EGTA treatment and is pseudocolored according to fluorescence intensity (see C for color look-up table). (Scale bars: images, 5 μm; corresponding ROIs, 2 μm.) β-catenin–GFP fluorescence intensity changes in the ROIs were normalized to baseline and plotted over time (A and B Lower). (C) Kymograph showing β-catenin–GFP fluctuations at the junction and neighboring cytosol over time. The one-pixel line scan (marked by the two red arrowheads in A) was colorized, and the summary graph indicated a corresponding drop in the cytosol near the junction. (D) Kinetics of the β-catenin–GFP fluorescence change upon Ca2+ removal. EGTA was added at 30 s (n = 7; mean ± SEM). Data were fit with a Boltzmann function (red).

References

    1. Nagar B, Overduin M, Ikura M, Rini JM. Structural basis of calcium-induced E-cadherin rigidification and dimerization. Nature. 1996;380:360–364. - PubMed
    1. Tamura K, Shan WS, Hendrickson WA, Colman DR, Shapiro L. Structure-function analysis of cell adhesion by neural (N-) cadherin. Neuron. 1998;20:1153–1163. - PubMed
    1. Chitaev NA, Troyanovsky SM. Adhesive but not lateral E-cadherin complexes require calcium and catenins for their formation. J Cell Biol. 1998;142:837–846. - PMC - PubMed
    1. Pertz O, et al. A new crystal structure, Ca2+ dependence and mutational analysis reveal molecular details of E-cadherin homoassociation. EMBO J. 1999;18:1738–1747. - PMC - PubMed
    1. Koch AW, Pokutta S, Lustig A, Engel J. Calcium binding and homoassociation of E-cadherin domains. Biochemistry. 1997;36:7697–7705. - PubMed

Publication types

MeSH terms