Comparative Study
. 2011 Aug;106(2):849-59.
doi: 10.1152/jn.00559.2010. Epub 2011 May 25.

Fine frequency tuning in monkey auditory cortex and thalamus

Affiliations
Comparative Study

Fine frequency tuning in monkey auditory cortex and thalamus

Edward L Bartlett et al. J Neurophysiol. 2011 Aug.

Abstract

The frequency resolution of neurons throughout the ascending auditory pathway is important for understanding how sounds are processed. In many animal studies, the frequency tuning widths are about 1/5th octave wide in auditory nerve fibers and much wider in auditory cortex neurons. Psychophysical studies show that humans are capable of discriminating far finer frequency differences. A recent study suggested that this is perhaps attributable to fine frequency tuning of neurons in human auditory cortex (Bitterman Y, Mukamel R, Malach R, Fried I, Nelken I. Nature 451: 197-201, 2008). We investigated whether such fine frequency tuning was restricted to human auditory cortex by examining the frequency tuning width in the awake common marmoset monkey. We show that 27% of neurons in the primary auditory cortex exhibit frequency tuning that is finer than the typical frequency tuning of the auditory nerve and substantially finer than previously reported cortical data obtained from anesthetized animals. Fine frequency tuning is also present in 76% of neurons of the auditory thalamus in awake marmosets. Frequency tuning was narrower during the sustained response compared to the onset response in auditory cortex neurons but not in thalamic neurons, suggesting that thalamocortical or intracortical dynamics shape time-dependent frequency tuning in cortex. These findings challenge the notion that the fine frequency tuning of auditory cortex is unique to human auditory cortex and that it is a de novo cortical property, suggesting that the broader tuning observed in previous animal studies may arise from the use of anesthesia during physiological recordings or from species differences.


Figures
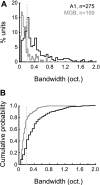
Fig. 1.
Fig. 1.
Primary auditory cortex (A1) and medial geniculate body (MGB) tuning bandwidths. A: distributions of bandwidths [at best sound level (BL)] for all A1 units (n = 275, black) and MGB units (n = 159, gray). B: cumulative distributions of A1 (black) and MGB (gray) bandwidths. Light gray dashed line indicates the typical bandwidth of auditory nerve fibers (0.2 oct.) that was used as a boundary to classify sharply tuned units from the rest of the population.
Fig. 2.
Fig. 2.
A1 single-neuron and population tuning properties. A and B: example spike raster and frequency response area of an A1 neuron. Shaded area in A is stimulus duration (50-ms pure tones in this case; both frequency and level were varied), black dots are spikes falling within analysis window, and gray dots are spontaneous spikes. Frequency and sound level are interleaved on the y-axis. This neuron was tuned to a single frequency bin (0.1-oct. sampling resolution) and also tuned to sound level (B). C: population tuning curves for entire population of A1 neurons computed during entire response duration (ON+SUS, black lines) and during sustained response alone (SUS, red lines). Orange line indicates baseline; gray lines delineate frequency tuning bandwidth at 50% maximal response for the entire response duration. Sharpening of the tuning curve is evident during the sustained portion of the response. D: same as in C, but computed for the sharpest 27% of A1 neurons (ST units). For this population, mean tuning width was 0.125 octaves over the entire response duration and <0.1 octaves during the sustained portion of the response. Significant lateral suppression also developed over response duration (red line). All plots are means ± SE.
Fig. 3.
Fig. 3.
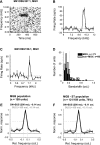
Auditory thalamus single-neuron and population tuning properties. A and B: example spike raster and frequency tuning curve of a MGB ventral division (MGV) neuron (unit M41OSU327.1). Sound level = 30 dB SPL. Shaded area in A is stimulus duration (200-ms pure tones). Black dots are spikes. Clear responses occur only in 2 frequency bins (1/24th oct. spacing), also apparent in the frequency tuning curve in B. C: example frequency tuning curve of an MGV neuron with clear suppression on the low- and high-frequency sides of the tuning curve peak (unit M41OSU150.1). Sound level = 10 dB SPL. D: distribution of frequency tuning bandwidth at best level for MGB neurons, separated into neurons from MGV (black bars) and MGB neurons from non-MGV subdivisions (gray bars). Gray dashed line at 0.2-octave bandwidth separates units classified as sharply tuned (ST) or not sharply tuned (NST). E: population tuning curves for MGB neurons. Population tuning curves were computed over the entire response duration (ON+SUS, black line) or only during the sustained portion of the response, 100–200 ms after stimulus onset (SUS, gray line). Black dotted line indicates baseline. Light gray dashed lines delineate the frequency tuning bandwidth at 50% maximal response for the entire response duration. F: same as in E, but computed for ST units whose tuning bandwidths were <0.2 octaves. All plots are means ± SE.
Fig. 4.
Fig. 4.
A1 and MGB frequency tuning as a function of best frequency (BF). A: normalized BF distributions for ST (black bars) and NST (gray bars) units in A1. Bin width = 1/2 octave. The distributions were not statistically significant (n.s.; P = 0.43, Kolmogorov-Smirnoff test). B: bandwidth in kilohertz at half-maximal rate as a function of BF. In B–D, black circles represent ST units and gray triangles NST units. The mean and SE are plotted in 1/2-octave intervals. C: bandwidth in octaves as a function of BF. Same format as B. D: Q value at BL (QBL) as a function of BF. Same format as B. E: normalized BF distributions for ST (black bars) and NST (gray bars) units in MGB. Bin width = 1/2 octave. The distributions were significantly different (P < 0.01, Kolmogorov-Smirnoff test). F–H: bandwidth measures as a function of BF for MGB units. Same format as B–D.

References

    1. Aitkin LM, Webster WR, Veale JL, Crosby DC. Inferior colliculus. I. Comparison of response properties of neurons in central, pericentral, and external nuclei of adult cat. J Neurophysiol 38: 1196–1207, 1975 - PubMed
    1. Aitkin LM, Kudo M, Irvine DR. Connections of the primary auditory cortex in the common marmoset, Callithrix jacchus jacchus. J Comp Neurol 269: 235–248, 1988 - PubMed
    1. Allon N, Yeshurun Y, Wollberg Z. Responses of single cells in the medial geniculate body of awake squirrel monkeys. Exp Brain Res 41: 222–232, 1981 - PubMed
    1. Barbour DL, Wang X. Contrast tuning in auditory cortex. Science 299: 1073–1075, 2003 - PMC - PubMed
    1. Bartlett EL, Wang X. Neural representations of temporally modulated signals in the auditory thalamus of awake primates. J Neurophysiol 97: 1005–1017, 2007 - PubMed

Publication types

LinkOut - more resources