Comparative Study
. 2011 Aug;106(2):764-74.
doi: 10.1152/jn.00626.2010. Epub 2011 May 25.

Statistical assessment of the stability of neural movement representations

Affiliations
Comparative Study

Statistical assessment of the stability of neural movement representations

Ian H Stevenson et al. J Neurophysiol. 2011 Aug.

Abstract

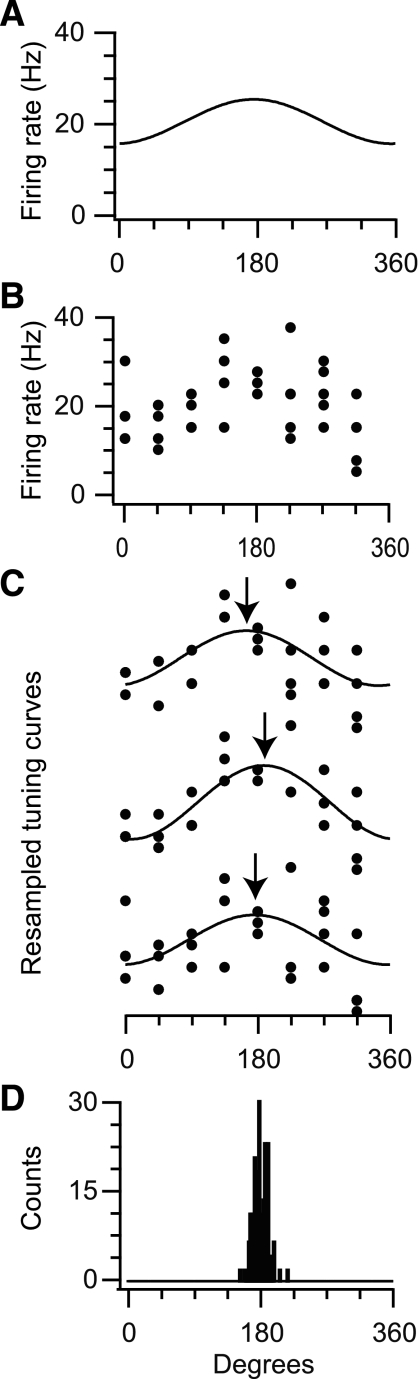
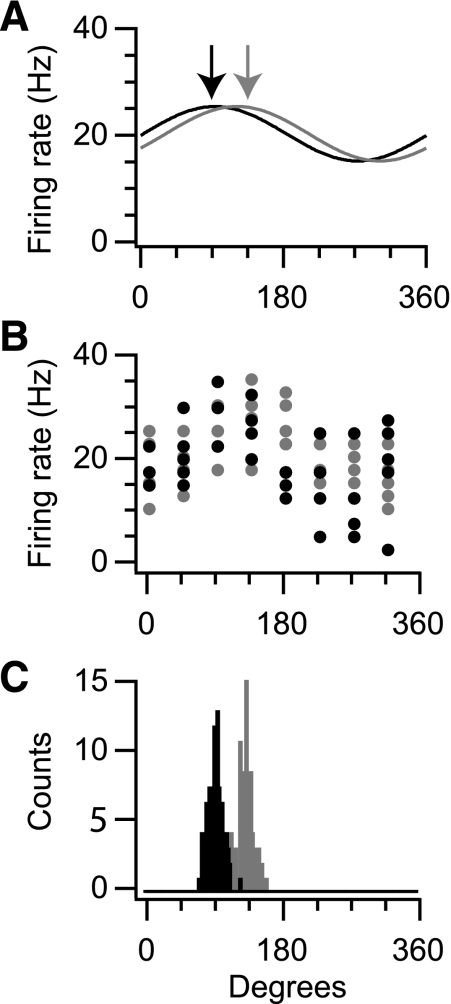
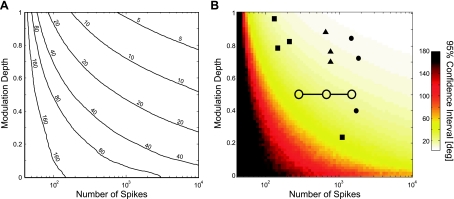
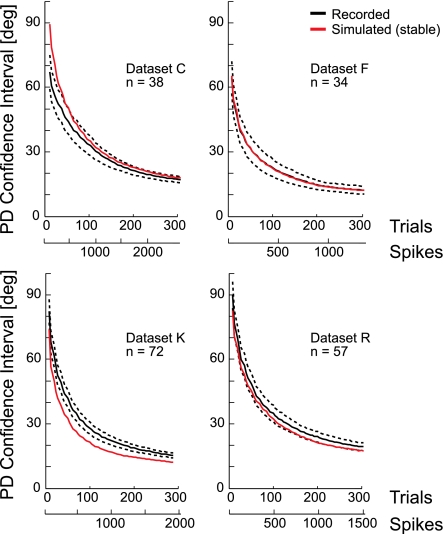
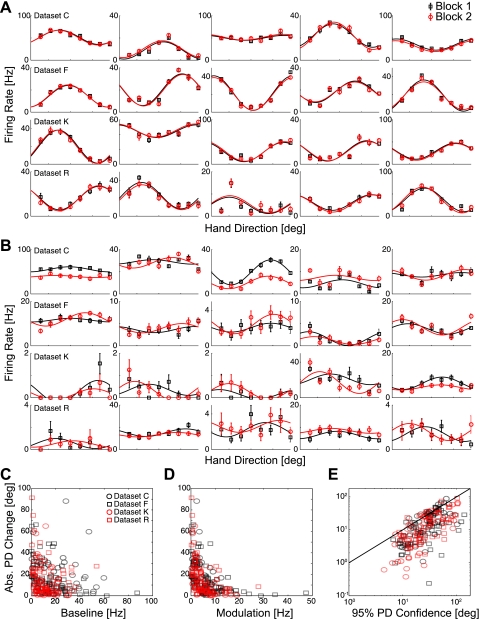
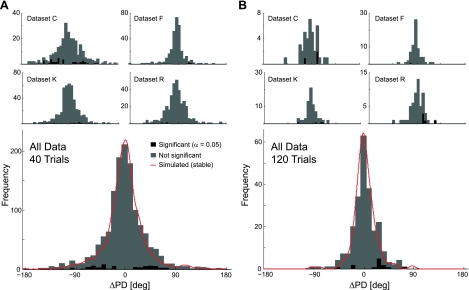
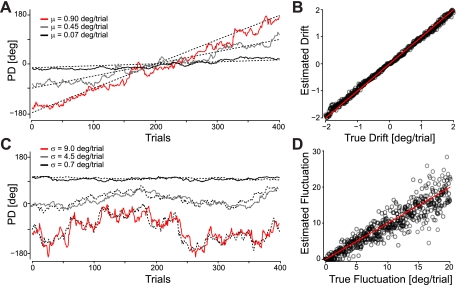
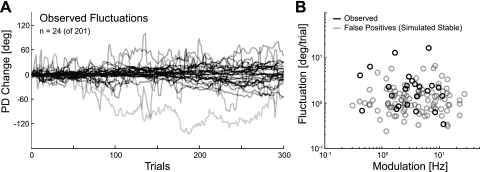
In systems neuroscience, neural activity that represents movements or sensory stimuli is often characterized by spatial tuning curves that may change in response to training, attention, altered mechanics, or the passage of time. A vital step in determining whether tuning curves change is accounting for estimation uncertainty due to measurement noise. In this study, we address the issue of tuning curve stability using methods that take uncertainty directly into account. We analyze data recorded from neurons in primary motor cortex using chronically implanted, multielectrode arrays in four monkeys performing center-out reaching. With the use of simulations, we demonstrate that under typical experimental conditions, the effect of neuronal noise on estimated preferred direction can be quite large and is affected by both the amount of data and the modulation depth of the neurons. In experimental data, we find that after taking uncertainty into account using bootstrapping techniques, the majority of neurons appears to be very stable on a timescale of minutes to hours. Lastly, we introduce adaptive filtering methods to explicitly model dynamic tuning curves. In contrast to several previous findings suggesting that tuning curves may be in constant flux, we conclude that the neural representation of limb movement is, on average, quite stable and that impressions to the contrary may be largely the result of measurement noise.


Figures

Fig. 1.
Fig. 1.
Measurement noise for a simulated neuron with known tuning. A: idealized cosine-tuning function of a neuron with typical movement-related discharge (20 Hz) and a modulation (5 Hz). B: 40 trials simulated during movement in 8 directions with Poisson spike noise. C: 3 example bootstrap samples from the initial set of observations in B. Note that there is substantial variability in the estimated preferred direction (PD; arrows). D: using many bootstrap samples, we build a distribution of PDs that allows estimation of confidence intervals. In this case, the 95% confidence interval spans ∼40°.
Fig. 2.
Fig. 2.
Measurement noise affects the ability to detect PD changes. A: cosine-tuning curves for a pair of simulated neurons having PDs of 90° (black) and 135° (gray). B: 40 trials simulated from each of these tuning curves during movement in 8 directions with Poisson spike noise. C: bootstrap distributions for the PD based on the data in B. Note that there is overlap between these distributions, and the differences between the two distributions allow us to assess whether there is a significant tuning difference between the two conditions.
Fig. 3.
Fig. 3.
Uncertainty in PD as a function of the number of spikes and modulation depth of a simulated neuron. Uncertainty about the PD decreases both with increasing number of observations and increasing modulation. A: contour plots illustrating the width of the 95% confidence intervals. Levels denote 1-sided 95% confidence intervals in degrees. For instance, for 0 observations or a modulation of 0, the confidence intervals span ±180°. B: color plot of same values with representative examples from 3 published studies: ■, Rokni et al. (2007); •, Kalaska et al. (1989); ▴, Wise et al. (1998). The average confidence intervals for the data used here are shown as open circles for blocks of 40, 120, and 240 trials (from left to right).
Fig. 4.
Fig. 4.
Uncertainty in PD with increasing numbers of trials for 4 sets of data collected from 4 different monkeys. Average size of the 95% confidence interval for populations of actual (black) and simulated neurons (red). Simulated data were generated by estimating stable, nondrifting tuning curves from the recorded neurons and simulating spiking with Poisson noise. The average number of spikes/neuron is shown to relate these results directly to Fig. 3. Dashed lines denote ± SEM across neurons.
Fig. 5.
Fig. 5.
Changes in tuning across blocks of 120 trials. Tuning curves for the 1st (black) and 2nd (red) blocks of 120 trials for the 5 most stable neurons (A) and the 5 least stable (B) from each of the 4 datasets. Error bars denote mean firing rate ± SEM; solid lines denote cosine fits. The size [absolute (Abs.) value] of the PD change is negatively correlated with the baseline firing rate (C) as well as modulation (D). Higher uncertainty in the estimate of PD is correlated with larger apparent drift (E). These correlations suggest that estimated changes in PD could be due to measurement noise.
Fig. 6.
Fig. 6.
Estimated changes in PD. A: histograms of PD changes for each of the datasets separately and for all neurons for a block size of 40 trials. B: PD changes for a block size of 120 trials. Black blocks denote changes that were significant at the 95% level by bootstrapping. Note that for blocks of 40 trials, the variability of changes between blocks is substantially higher than for blocks of 120 trials, suggesting that measurement noise plays a large role in determining the magnitude of PD changes. Red curves denote the PD changes observed when simulating stable Poisson neurons that were matched to have the same tuning as the observed data.
Fig. 7.
Fig. 7.
Adaptive filtering for detecting drift and fluctuation. A: true and estimated PD for 3 simulated neurons with PDs drifting 0.9, 0.45, and 0.07°/trial. Dashed lines denote the true, underlying PD. B: estimated PD drift as a function of the true drift for 512 simulation runs using data from 400 trials. C: true and estimated PD for 3 simulated neurons with no mean drift, fluctuating 9, 4.5, and 0.7°/trial. D: estimated PD fluctuation as a function of the true fluctuation for 512 simulation runs. For data from 400 trials, the degree of fluctuation is estimated fairly well but much less accurately than the mean drift.
Fig. 8.
Fig. 8.
Adaptive filtering for actual data. For this analysis, we combined neurons from all 4 datasets (C, F, K, and R) and use only the significantly tuned neurons (n = 201). Only 12% (n = 24) of these neurons showed some degree of fluctuation. A: trial-by-trial PD changes estimated by adaptive filtering for the subset of neurons that appeared to be fluctuating. Note that 177 of the 201 neurons were better fit by a stable rather than a dynamic tuning curve. B: estimated fluctuation as a function of the modulation for the subset of fluctuating neurons (black) and simulated, stable neurons (gray). The fluctuations revealed by adaptive filtering are consistent with false positives.

References

    1. Ahern GP, Klyachko VA, Jackson MB. cGMP and S-nitrosylation: two routes for modulation of neuronal excitability by NO. Trends Neurosci 25: 510–517, 2002 - PubMed
    1. Amirikian B, Georgopulos AP. Directional tuning profiles of motor cortical cells. Neurosci Res 36: 73–79, 2000 - PubMed
    1. Barnes CA, McNaughton BL, Goddard GV, Douglas RM, Adamec R. Circadian rhythm of synaptic excitability in rat and monkey central nervous system. Science 197: 91–92, 1977 - PubMed
    1. Berens P. CircStat: a MATLAB toolbox for circular statistics. J Stat Softw 31: 1–21, 2009
    1. Brown E, Nguyen D, Frank L, Wilson M, Solo V. An analysis of neural receptive field plasticity by point process adaptive filtering. Proc Natl Acad Sci USA 98: 12261–12266, 2001 - PMC - PubMed

Publication types

LinkOut - more resources