

Quantitative proton magnetic resonance spectroscopy and spectroscopic imaging of the brain: a didactic review
- PMID: 21613876
- PMCID: PMC3103086
- DOI: 10.1097/RMR.0b013e31821e568f
Quantitative proton magnetic resonance spectroscopy and spectroscopic imaging of the brain: a didactic review
Abstract
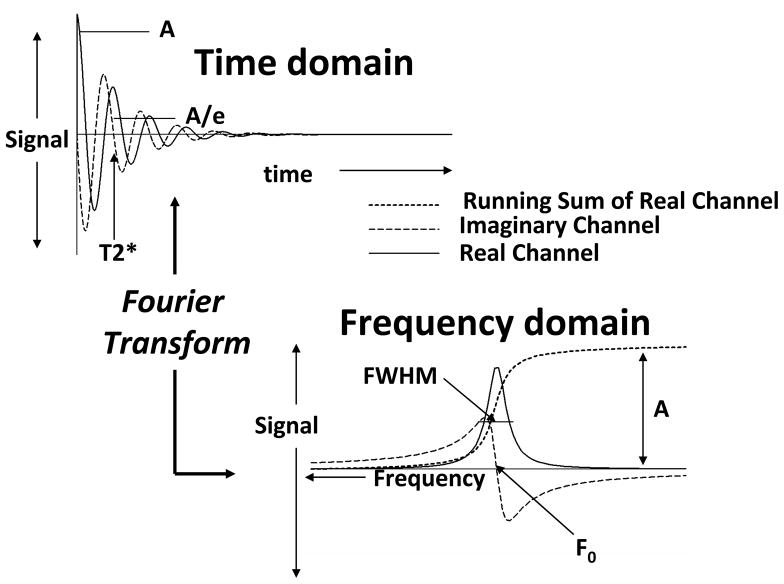
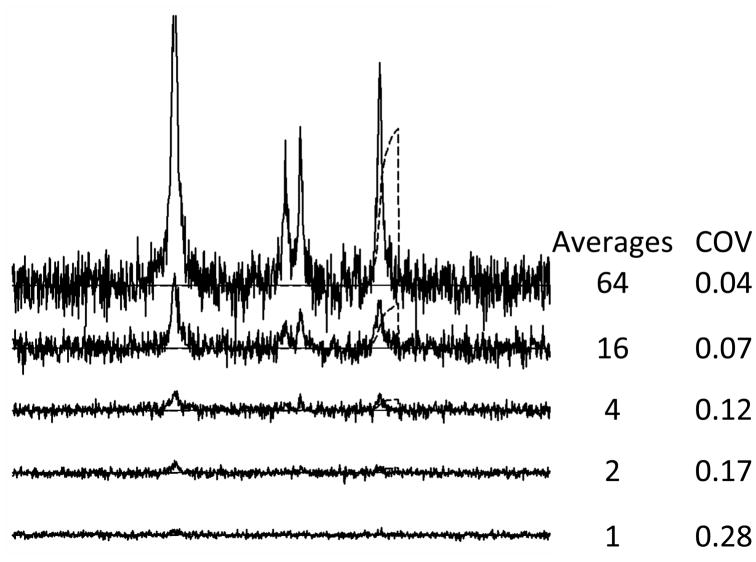
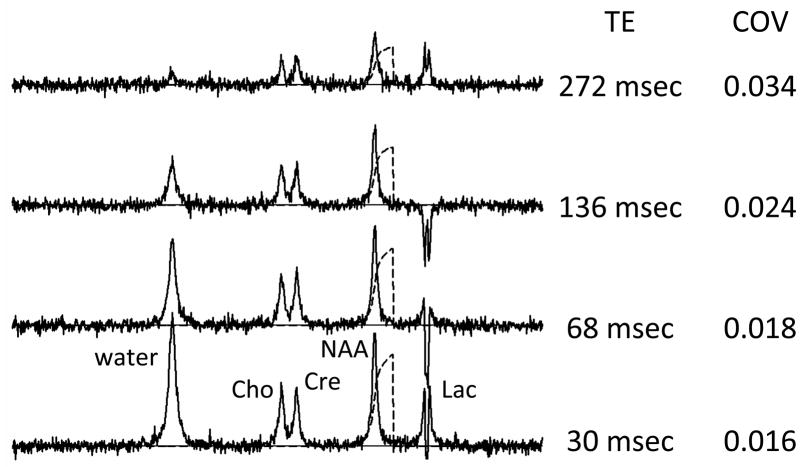
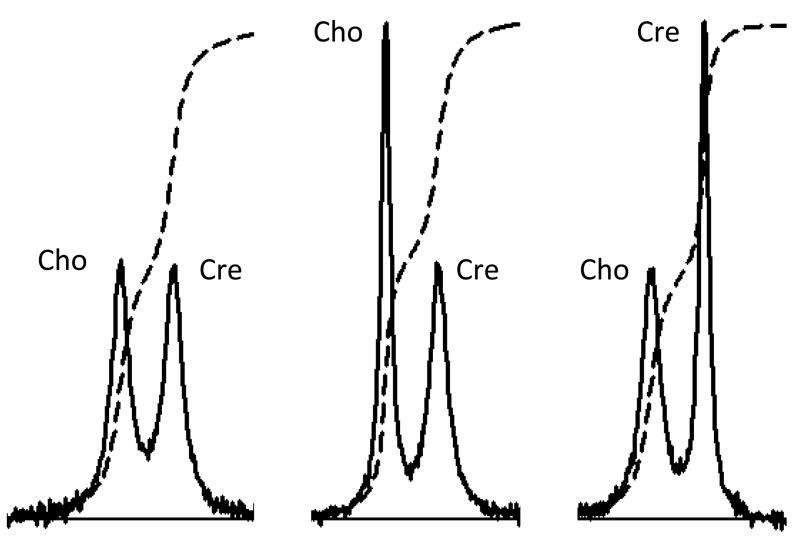
This article presents background information related to methodology for estimating brain metabolite concentration from magnetic resonance spectroscopy (MRS) and magnetic resonance spectroscopic imaging measurements of living human brain tissue. It reviews progress related to this methodology, with emphasis placed on progress reported during the past 10 years. It is written for a target audience composed of radiologists and magnetic resonance imaging technologists. It describes in general terms the relationship between MRS signal amplitude and concentration. It then presents an overview of the many practical problems associated with deriving concentration solely from absolute measured signal amplitudes and demonstrates how a various signal calibration approaches can be successfully used. The concept of integrated signal amplitude is presented with examples that are helpful for qualitative reading of MRS data as well as for understanding the methodology used for quantitative measurements. The problems associated with the accurate measurement of individual signal amplitudes in brain spectra having overlapping signals from other metabolites and overlapping nuisance signals from water and lipid are presented. Current approaches to obtaining accurate amplitude estimates with least-squares fitting software are summarized.
Figures
References
-
- Bottomley PA. The trouble with spectroscopy papers. Radiology. 1991;181(2):344–350. - PubMed
-
- Helms G. The principles of quantification applied to in vivo proton MR spectroscopy. Eur J Radiol. 2008;67(2):218–229. - PubMed
-
- Jansen JF, Backes WH, Nicolay K, Kooi ME. 1H MR spectroscopy of the brain: absolute quantification of metabolites. Radiology. 2006;240(2):318–332. - PubMed
-
- Knight-Scott J, Haley AP, Rossmiller SR, et al. Molality as a unit of measure for expressing 1H MRS brain metabolite concentrations in vivo. Magn Reson Imaging. 2003;21(7):787–797. - PubMed
-
- Jost G, Harting I, Heiland S. Quantitative single-voxel spectroscopy: the reciprocity principle for receive-only head coils. J Magn Reson Imaging. 2005;21(1):66–71. - PubMed
Publication types
MeSH terms
Substances
Grants and funding
- R01 NS036524/NS/NINDS NIH HHS/United States
- RC1MH088507/MH/NIMH NIH HHS/United States
- R01 MH081864/MH/NIMH NIH HHS/United States
- R21MH075658/MH/NIMH NIH HHS/United States
- R21 MH075658/MH/NIMH NIH HHS/United States
- R01 MH085900/MH/NIMH NIH HHS/United States
- P01NS058489/NS/NINDS NIH HHS/United States
- P01 NS058489/NS/NINDS NIH HHS/United States
- R01NS036524/NS/NINDS NIH HHS/United States
- RC1 MH088507/MH/NIMH NIH HHS/United States
- R01MH081864/MH/NIMH NIH HHS/United States
- R01EB00822/EB/NIBIB NIH HHS/United States
- R01 EB000822/EB/NIBIB NIH HHS/United States
LinkOut - more resources
Full Text Sources
Miscellaneous
