

Probing cellular protein complexes using single-molecule pull-down
- PMID: 21614075
- PMCID: PMC3103084
- DOI: 10.1038/nature10016
Probing cellular protein complexes using single-molecule pull-down
Abstract
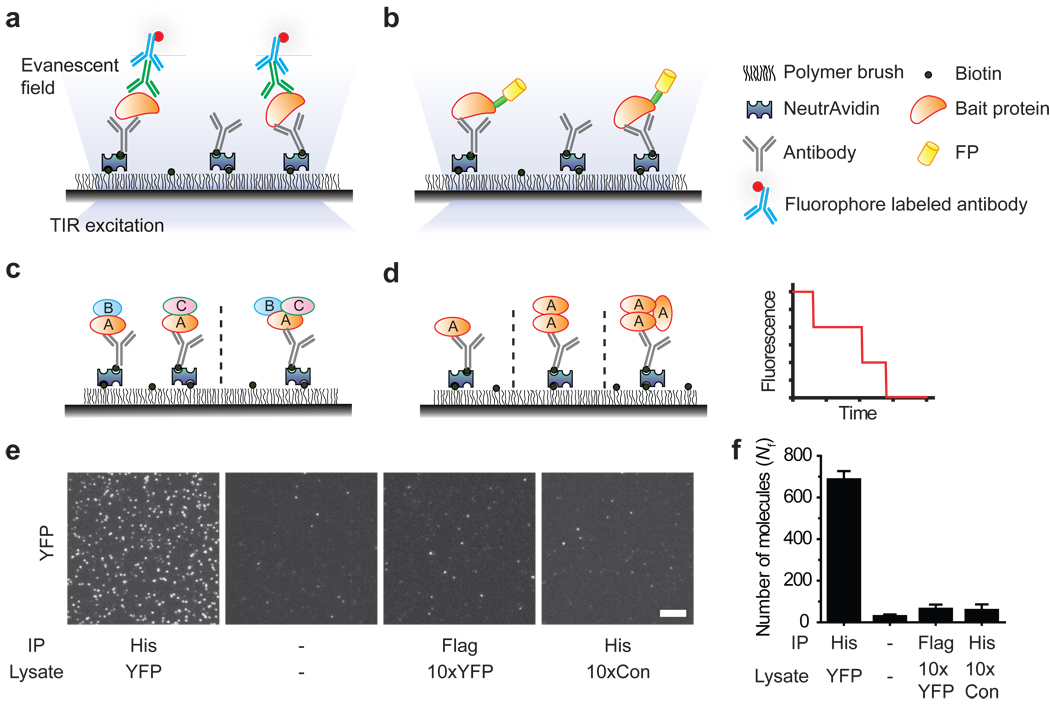
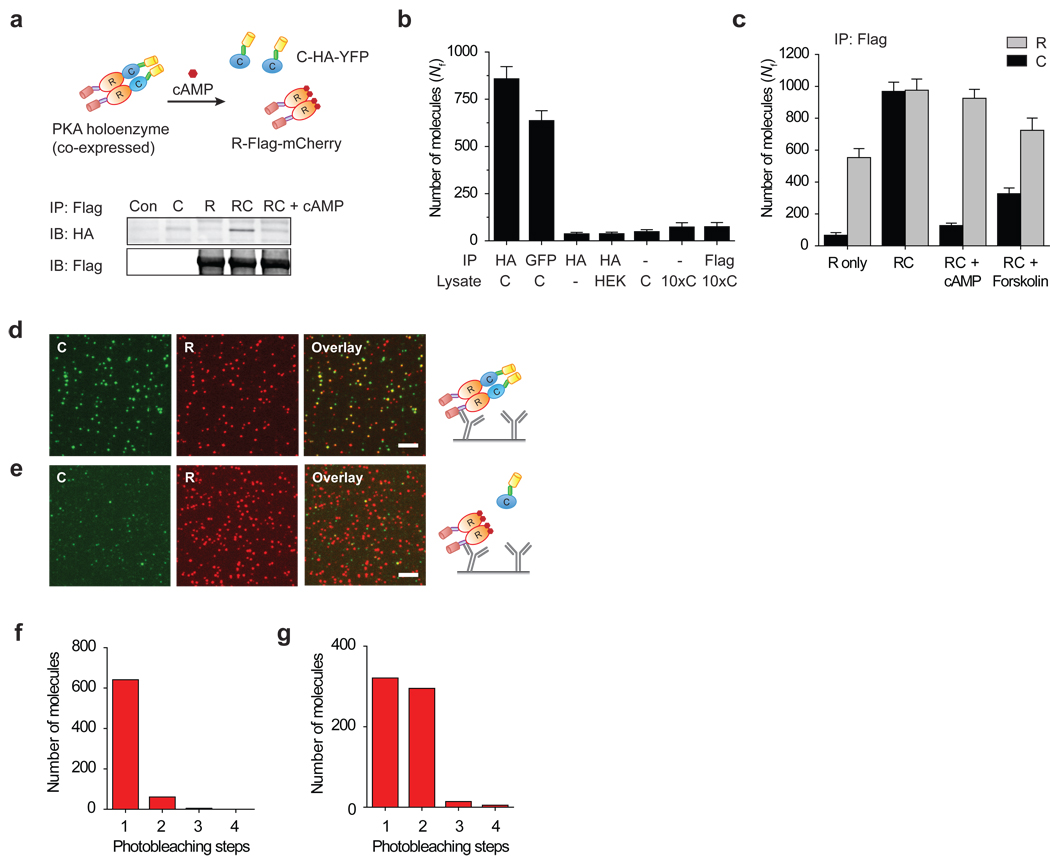
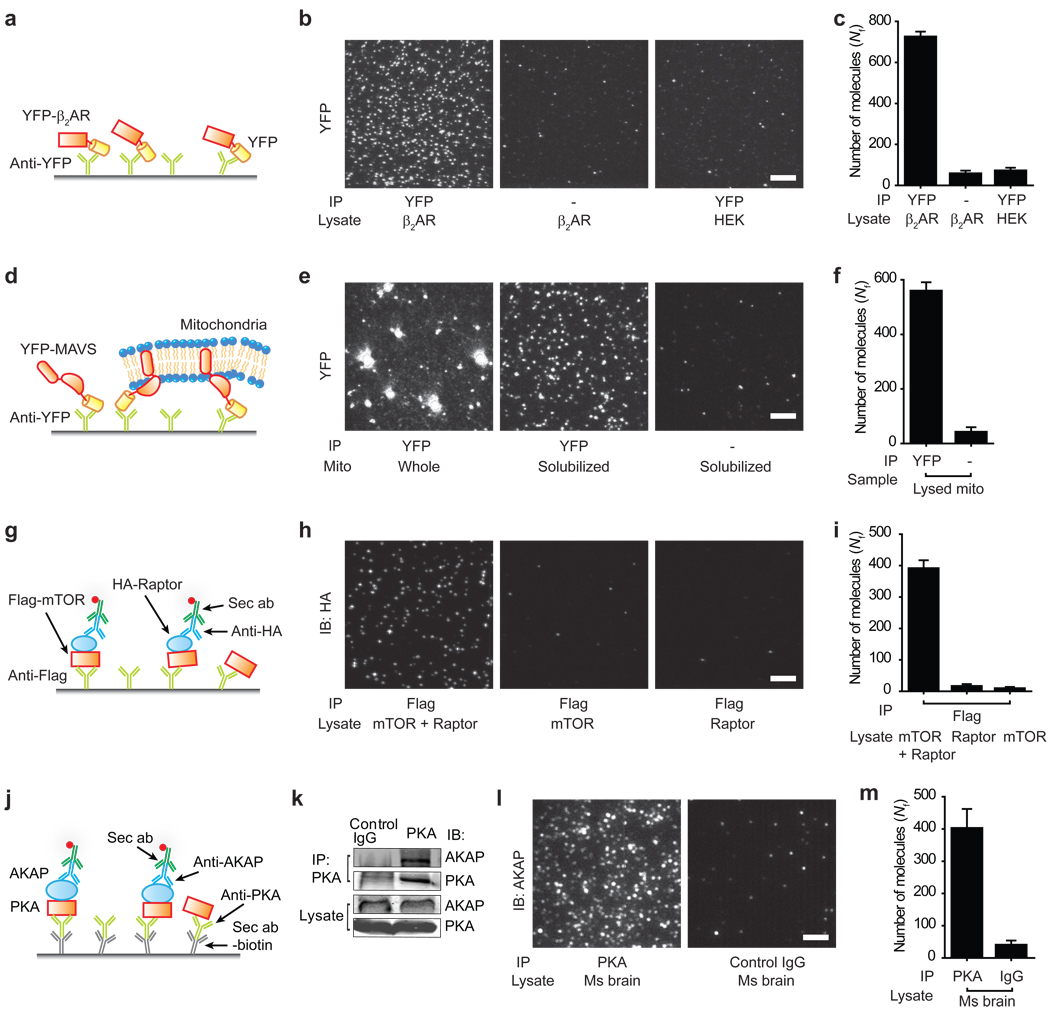
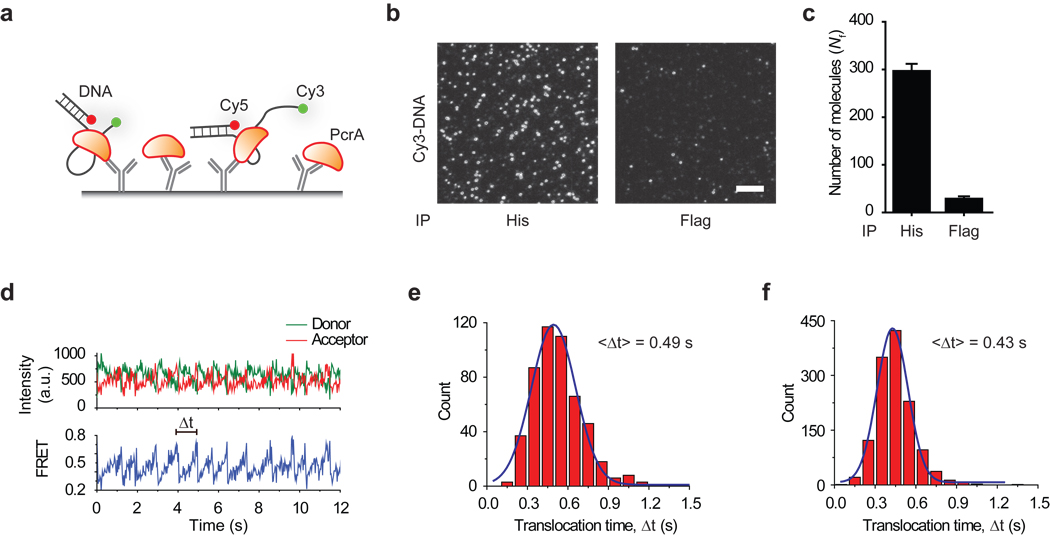
Proteins perform most cellular functions in macromolecular complexes. The same protein often participates in different complexes to exhibit diverse functionality. Current ensemble approaches of identifying cellular protein interactions cannot reveal physiological permutations of these interactions. Here we describe a single-molecule pull-down (SiMPull) assay that combines the principles of a conventional pull-down assay with single-molecule fluorescence microscopy and enables direct visualization of individual cellular protein complexes. SiMPull can reveal how many proteins and of which kinds are present in the in vivo complex, as we show using protein kinase A. We then demonstrate a wide applicability to various signalling proteins found in the cytosol, membrane and cellular organelles, and to endogenous protein complexes from animal tissue extracts. The pulled-down proteins are functional and are used, without further processing, for single-molecule biochemical studies. SiMPull should provide a rapid, sensitive and robust platform for analysing protein assemblies in biological pathways.
Figures
Comment in
-
Protein-protein interactions: Pull-down for single molecules.Nature. 2011 May 26;473(7348):461-2. doi: 10.1038/473461a. Nature. 2011. PMID: 21614072 No abstract available.
-
Single molecules made simple.Nat Methods. 2011 Jul;8(7):535. doi: 10.1038/nmeth0711-535. Nat Methods. 2011. PMID: 21850734 No abstract available.
References
-
- Alberts B. The cell as a collection of protein machines: preparing the next generation of molecular biologists. Cell. 1998;92:291–294. - PubMed
-
- Papin JA, Hunter T, Palsson BO, Subramaniam S. Reconstruction of cellular signalling networks and analysis of their properties. Nat Rev Mol Cell Biol. 2005;6:99–111. - PubMed
-
- Gavin AC, et al. Functional organization of the yeast proteome by systematic analysis of protein complexes. Nature. 2002;415:141–147. - PubMed
-
- Yamada T, Bork P. Evolution of biomolecular networks: lessons from metabolic and protein interactions. Nat Rev Mol Cell Biol. 2009;10:791–803. - PubMed
-
- Barrios-Rodiles M, et al. High-throughput mapping of a dynamic signaling network in mammalian cells. Science. 2005;307:1621–1625. - PubMed
Publication types
MeSH terms
Substances
Grants and funding
LinkOut - more resources
Full Text Sources
Other Literature Sources
Molecular Biology Databases
