

Exploratory 7-Tesla magnetic resonance spectroscopy in Huntington's disease provides in vivo evidence for impaired energy metabolism
- PMID: 21614431
- PMCID: PMC3225625
- DOI: 10.1007/s00415-011-6099-5
Exploratory 7-Tesla magnetic resonance spectroscopy in Huntington's disease provides in vivo evidence for impaired energy metabolism
Abstract
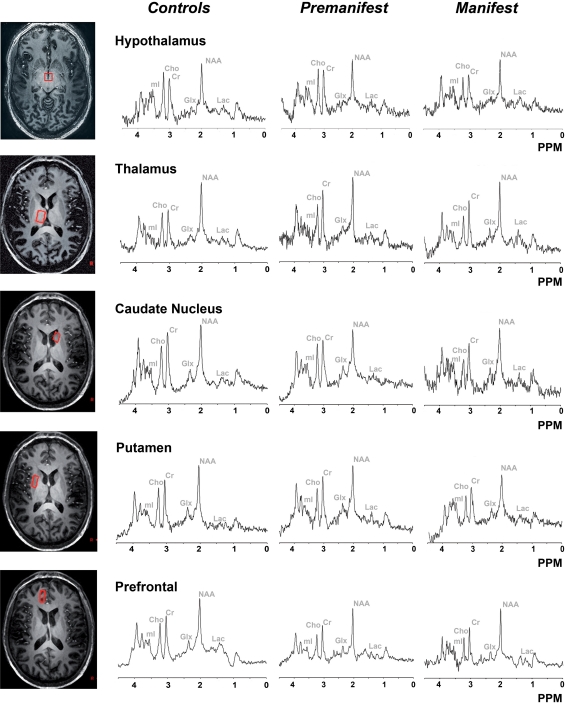
Huntington's disease (HD) is a neurodegenerative genetic disorder that affects the brain. Atrophy of deep grey matter structures has been reported and it is likely that underlying pathologic processes occur before, or in concurrence with, volumetric changes. Measurement of metabolite concentrations in these brain structures has the potential to provide insight into pathological processes. We aim to gain understanding of metabolite changes with respect to the disease stage and pathophysiological changes. We studied five brain regions using magnetic resonance spectroscopy (MRS) using a 7-Tesla MRI scanner. Localized proton spectra were acquired to obtain six metabolite concentrations. MRS was performed in the caudate nucleus, putamen, thalamus, hypothalamus, and frontal lobe in 44 control subjects, premanifest gene carriers and manifest HD. In the caudate nucleus, HD patients display lower NAA (p = 0.009) and lower creatine concentration (p = 0.001) as compared to controls. In the putamen, manifest HD patients show lower NAA (p = 0.024), lower creatine concentration (p = 0.027), and lower glutamate (p = 0.013). Although absolute values of NAA, creatine, and glutamate were lower, no significant differences to controls were found in the premanifest gene carriers. The lower concentrations of NAA and creatine in the caudate nucleus and putamen of early manifest HD suggest deficits in neuronal integrity and energy metabolism. The changes in glutamate could support the excitotoxicity theory. These findings not only give insight into neuropathological changes in HD but also indicate that MRS can possibly be applied in future clinical trails to evaluate medication targeted at specific metabolic processes.
Figures
References
-
- Aylward EH, Anderson NB, Bylsma FW, Wagster MV, Barta PE, Sherr M, Feeney J, Davis A, Rosenblatt A, Pearlson GD, Ross CA. Frontal lobe volume in patients with Huntington’s disease. Neurology. 1998;50:252–258. - PubMed
-
- Aylward EH, Sparks BF, Field KM, Yallapragada V, Shpritz BD, Rosenblatt A, Brandt J, Gourley LM, Liang K, Zhou H, Margolis RL, Ross CA. Onset and rate of striatal atrophy in preclinical Huntington disease. Neurology. 2004;63:66–72. - PubMed
-
- Beck AT, Steer RA, Brown GK. BDI-II, Beck Depression Inventory: Manual. 2. San Antonio: Harcourt Brace; 1996.
MeSH terms
LinkOut - more resources
Full Text Sources
Other Literature Sources
Medical
